Strait of Hormuz Crisis 2026: Global Oil Market Disruption Analysis
Comprehensive analysis of the largest oil supply disruption in history, examining price impacts, inventory depletion timelines, and strategic implications for global energy markets.
Executive Summary
Key Findings:
- Current supply disruption: 14.5–16.5 million barrels per day (mb/d) net shortfall
- Brent crude price surge: From $65/bbl (late February) to $109–112/bbl (early April 2026)
- IEA strategic reserve release: Record 400 million barrels coordinated on March 11, 2026
- Global oil supply projected plunge: 8 mb/d in March 2026 alone (IEA OMR)
- Inventory coverage window: 73–124 days before reserves exhausted (IEA + Industry stocks)
- Most exposed importers: India (20–25 days inventory), Pakistan, Bangladesh at critical energy stress
- Cumulative deficit projection: 120–180 million barrels by Q3 2026 if closure persists
- Equilibrium price model suggests $140–180/bbl range for sustained disruption scenarios
The Strait of Hormuz closure initiated on February 28, 2026 following US and Israeli military strikes on Iran represents the largest supply disruption in the history of the global oil market according to IEA Executive Director Fatih Birol. With 20% of global oil consumption and 25% of seaborne oil trade flowing through this corridor, the effective closure has triggered unprecedented market stress, forcing coordinated emergency responses and exposing critical vulnerabilities in global energy security architecture.
1. Background / Context
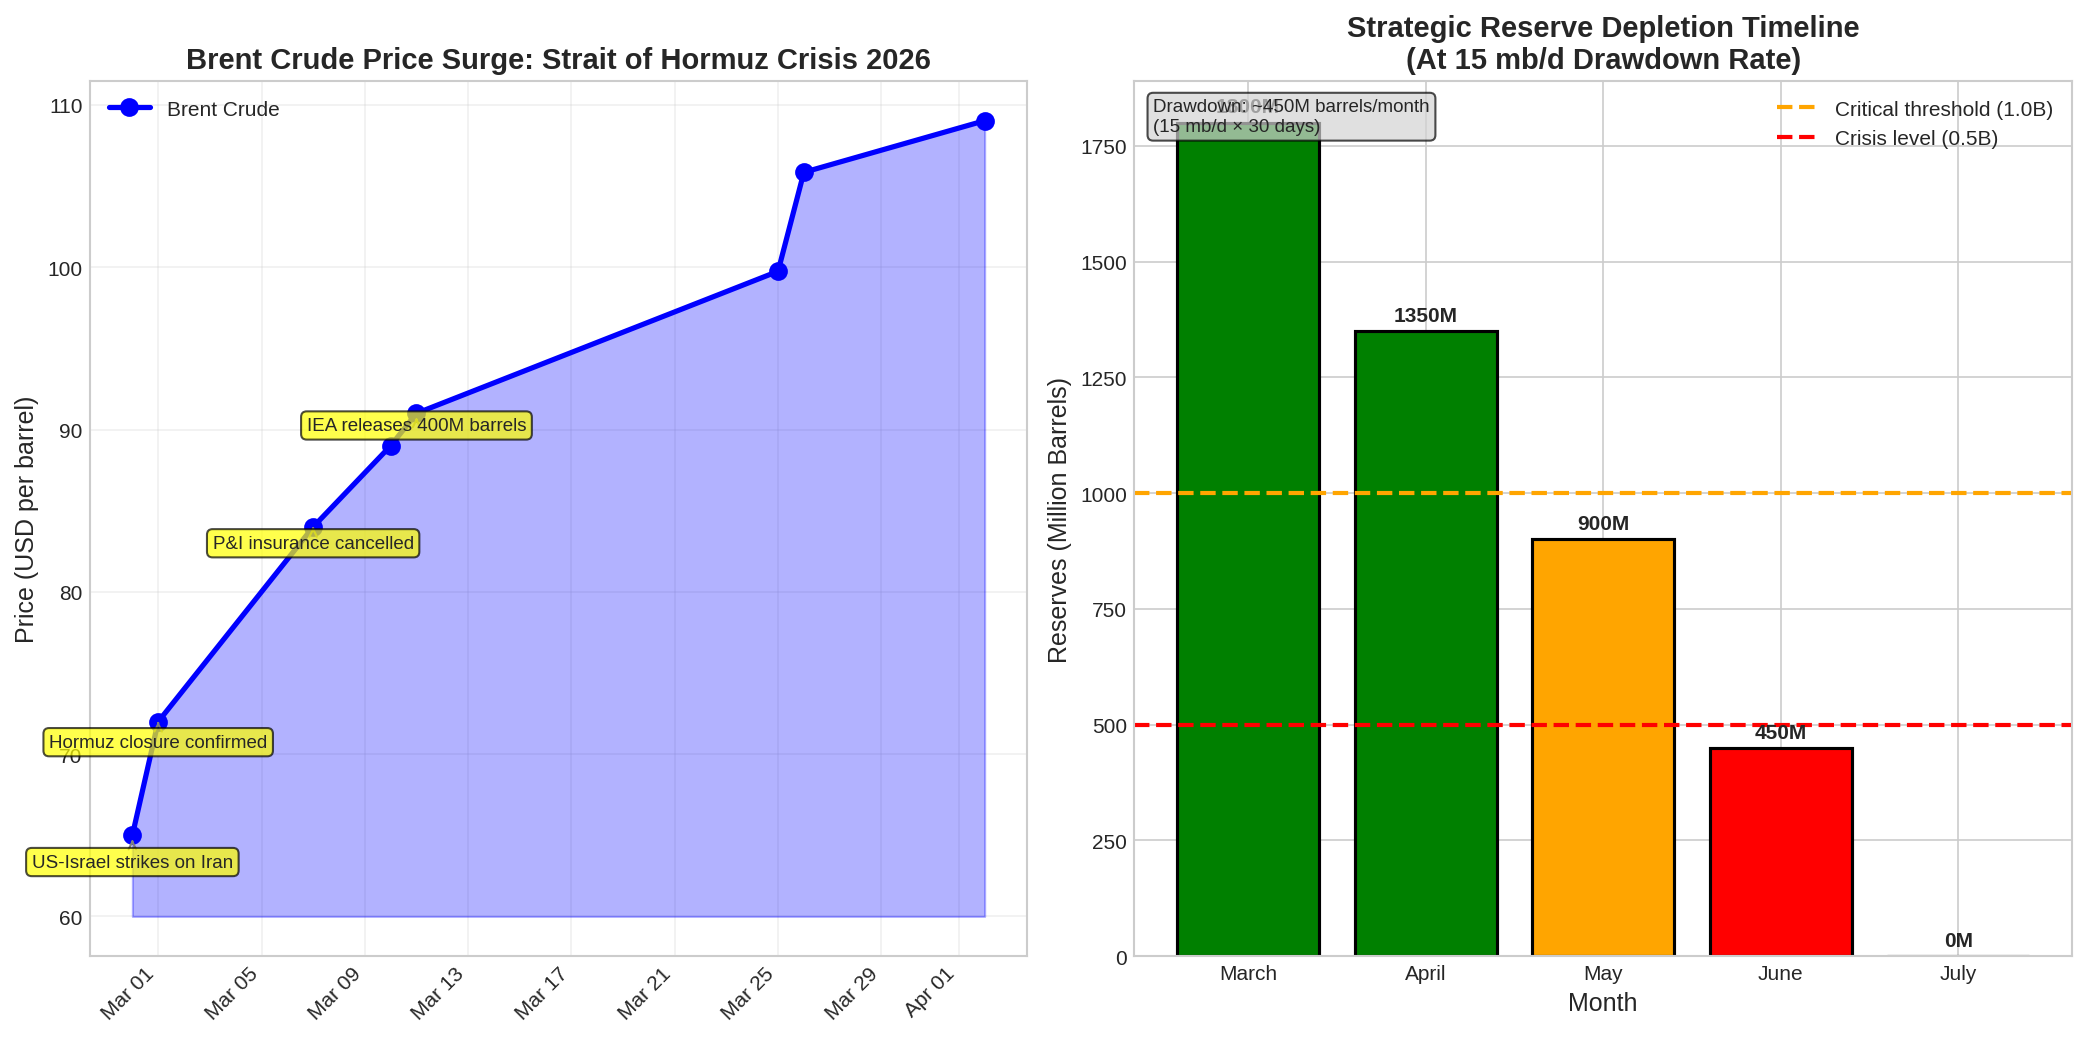 Figure 1: Brent crude price surge following the Strait of Hormuz closure, with key crisis milestones annotated.
1.1 Crisis Timeline and Escalation
The crisis unfolded with remarkable speed:
| Date | Event | Market Impact |
|---|---|---|
| February 28, 2026 | US and Israeli military strikes on Iran begin | Initial price spike: +8–12% in first 48 hours |
| March 2, 2026 | IRGC confirms Strait effectively closed; tanker traffic near zero | War risk insurance premiums double (0.25% → 0.5%+ per transit) |
| March 5, 2026 | P&I insurance cancelled for Gulf transits; 150+ tankers anchored outside strait | Physical freight rates surge; spot LNG rates jump 40%+ in single session |
| March 10, 2026 | UKMTO reports 13 confirmed incidents involving commercial vessels across Persian Gulf | Major carriers (Maersk, MSC, CMA CGM) suspend transits entirely |
| March 11, 2026 | IEA announces coordinated release of 400 million barrels from strategic reserves | Largest emergency release in IEA history; US contributes 172 million barrels |
| March–April 2026 | Houthi attacks resume in Red Sea; both Middle East maritime corridors blocked simultaneously | Global shipping capacity constrained on two critical routes concurrently |
1.2 Strategic Importance of the Strait
The Strait of Hormuz is not merely a regional chokepoint—it is the critical energy artery for the global economy:
Key Flow Statistics (2024–2025 baseline):
- Daily oil volume: 18–20 million barrels per day (mb/d) of crude and petroleum liquids
- Global consumption share: ~20% of world petroleum liquids consumption (EIA)
- Seaborne trade share: ~25% of global seaborne oil trade (IEA)
- LNG volume: ~19% of global LNG shipments transit the corridor
- Geographic constraint: Only 21 miles wide at narrowest point; no viable alternative maritime route
Primary Exporters Using the Strait:
- Saudi Arabia (7–8 mb/d exports)
- UAE (3–4 mb/d exports)
- Iraq (2.5–3 mb/d exports)
- Kuwait (1.8–2 mb/d exports)
- Qatar (primarily LNG; 140+ billion cubic meters gas annually)
Primary Importers Dependent on Hormuz:
- China: ~40% of oil imports transit the strait
- India: 53% of LNG from Qatar/UAE; critical for power generation
- Japan: ~70% of oil imports
- South Korea: Significant crude and LNG dependency
Destination Distribution: Approximately 80–84% of crude oil and condensate moving through Hormuz is destined for Asian markets, making East Asia the most immediately exposed region to supply disruption.
1.3 Existing Mitigation Infrastructure and Capacity Gaps
Pipeline Rerouting Options:
- Saudi East-West Pipeline: 5 mb/d capacity (crude to Red Sea)
- UAE pipelines: Limited capacity for partial bypass
- Total rerouting potential: 3.5–5.5 mb/d (IEA estimate)
- Net shortfall if full closure: 14.5–16.5 mb/d
2. Key Drivers / Underlying Factors
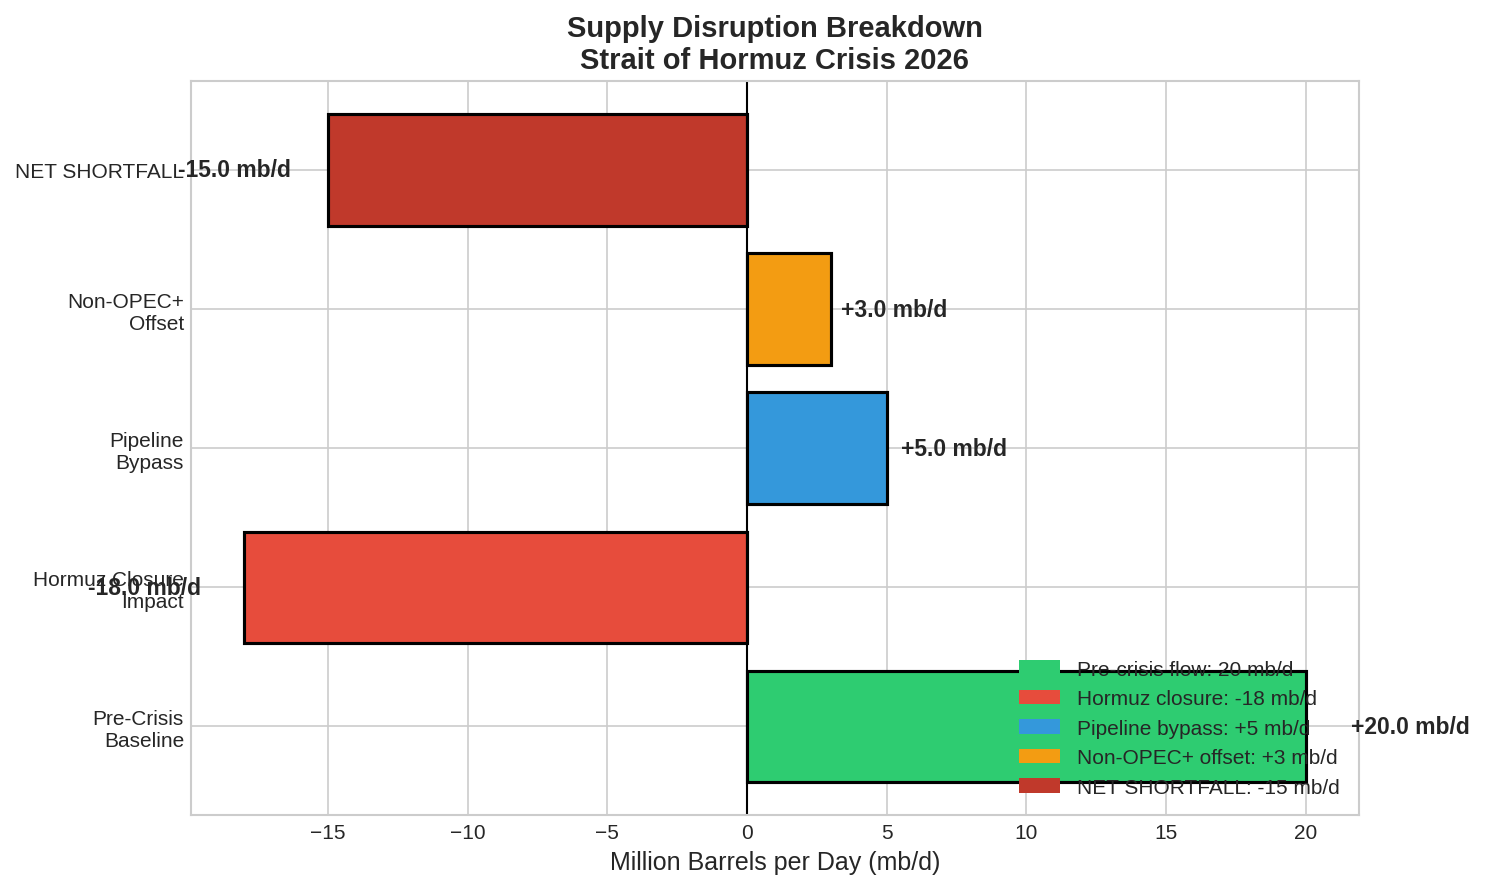 Figure 2: Component analysis of the net supply shortfall, showing how Hormuz closure impact is partially offset by pipeline bypass and non-OPEC+ production.
2.1 Primary Supply Disruption Mechanics
| Driver | Pre-Crisis Baseline | Current Status (March–April 2026) | Net Impact |
|---|---|---|---|
| Hormuz crude flows | 18–20 mb/d | Near zero (trickle) | -18 to -20 mb/d |
| Pipeline bypass capacity | N/A | 3.5–5.5 mb/d operational | +3.5 to +5.5 mb/d |
| Gulf production curtailments | Full capacity | -10 mb/d (storage filling) | -10 mb/d |
| Non-OPEC+ offset production | Baseline | +2–3 mb/d (approximate; Russia, Kazakhstan and other non-OPEC+ producers) | +2 to +3 mb/d |
| NET SUPPLY GAP | Balanced market | -14.5 to -16.5 mb/d | Largest disruption in oil market history |
2.2 Price Response Dynamics
Observed Price Trajectory:
- Pre-strike (late February): WTI $65–68/bbl; Brent $67–70/bbl
- March 10 (one week post-strike): WTI $86/bbl; Brent $89/bbl (+28–35% surge)
2.3 Demand-Side Considerations
Global Oil Demand Forecasts (Revised Post-Crisis):
- IEA February 2026 baseline: +850,000 b/d growth in 2026
- IEA March 2026 revision: +640,000 b/d growth (down 210,000 b/d)
- Widespread flight cancellations in Middle East: -1 mb/d demand impact (March–April)
- Industrial slowdown risk: Further demand destruction if prices sustain $120+/bbl
Regional Demand Elasticity Variations:
- OECD nations: Moderate price elasticity; demand destruction likely at $120+/bbl
- China: Strategic stockpiling may offset some price sensitivity; government-directed demand management
- India: Highly vulnerable; limited substitution options; economic growth at risk if prices persist above $100/bbl
2.4 Secondary Market Impacts and Spillover Effects
Shipping and Logistics:
- Bunker fuel (Singapore HSFO): +35% price increase
- War risk insurance premiums: 0.25% → 0.5–0.75% of vessel value per transit
- Example cost impact: $150M container vessel insurance rose from ~$375,000 to $750,000+ per transit
- Bunker Adjustment Factor (BAF) increases: 20–40% across major trade lanes
LNG Market Disruption:
- Qatar supplies 12–14% of European LNG (all via Hormuz)
- India imports 53% of LNG from Qatar/UAE region
- Spot LNG tanker rates: +40% in single trading session post-closure
Non-Oil Commodities Impacted (WEF Analysis):
- Fertilizers: 20% of seaborne fertilizer exports; 46% of urea trade from region
- Sulfur: Nearly half of global seaborne sulfur trade; critical for battery chemistry (nickel, cobalt refining)
- Methanol: One-third of global seaborne trade; China port inventories at risk
- Aluminium: 9% of global primary production from Middle East; 150,000+ tonnes pulled from LME warehouses
- Helium: Qatar supplies ~33% of global helium (semiconductor manufacturing, MRI scanners)
3. Implications / Impact Analysis
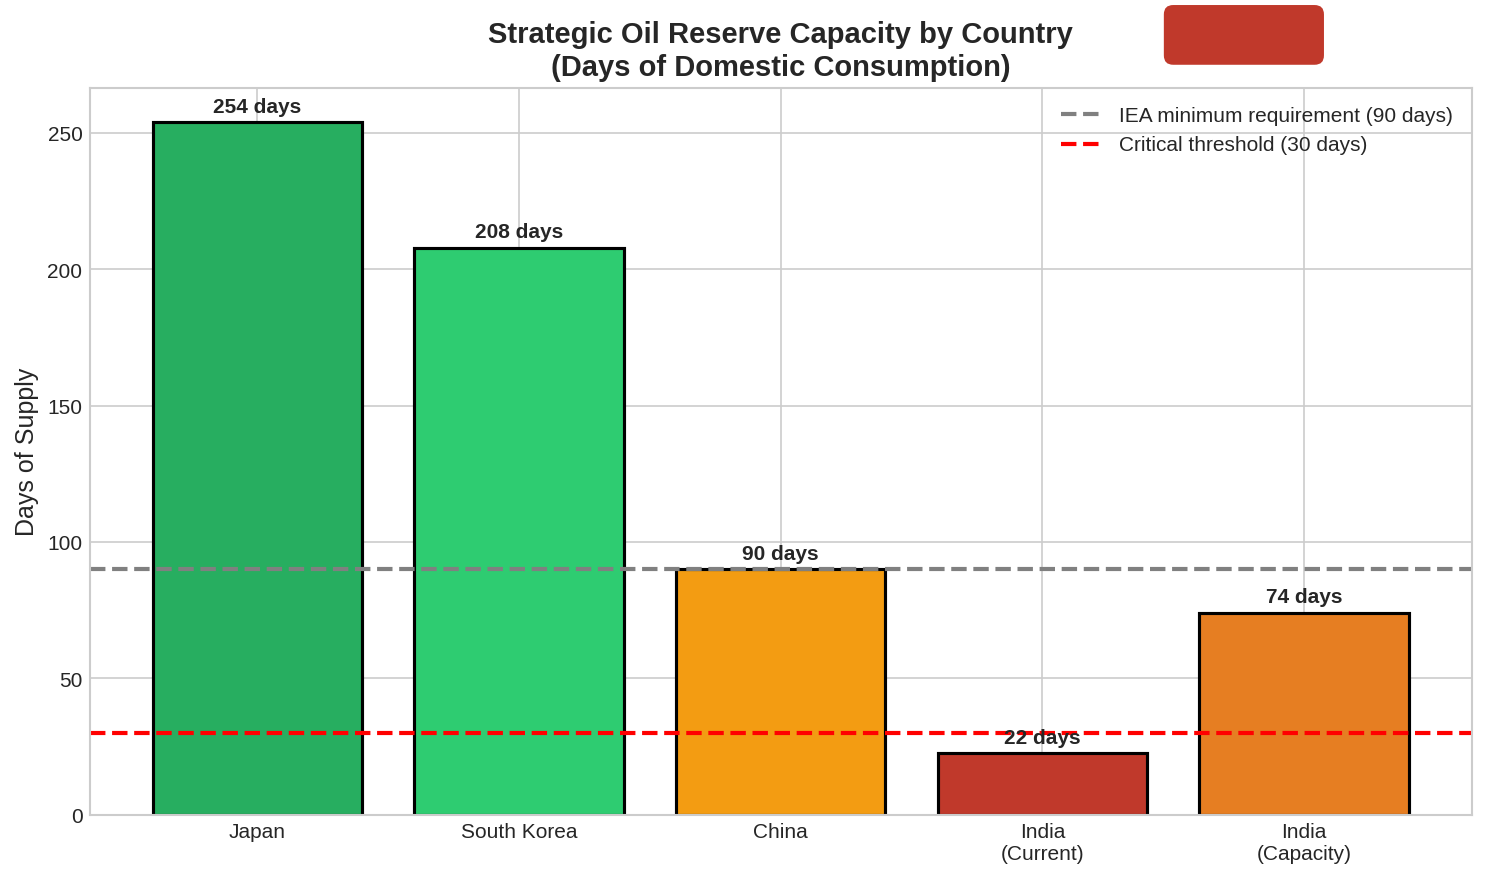 Figure 3: Strategic oil reserve capacity by country, highlighting India’s critical vulnerability with only 20–25 days of current inventory versus the IEA minimum requirement of 90 days.
3.1 Short-Term Outlook (Next 1–3 Months)
Inventory Depletion Trajectory: At a net shortfall of 15 mb/d, global emergency reserves deplete as follows:
Starting Reserves (IEA + Industry): 1.8 billion barrels
Daily Drawdown Rate: 15 mb/d
Time to Exhaustion: 120 days (theoretical maximum)

Note: This represents theoretical maximum coverage assuming constant 15 mb/d drawdown. Actual depletion may be faster (if conflict expands, demand remains inelastic) or slower (if prices trigger significant demand destruction, additional reserve releases occur, or partial supply restoration via pipelines).

Realistic Depletion Schedule:
- Month 1 (March): -450 million barrels; Reserves remaining: ~1.35 billion
- Month 2 (April): -450 million barrels; Reserves remaining: ~900 million
- Month 3 (May): -450 million barrels; Reserves remaining: ~450 million
- Month 4 (June): Reserves critically low; rationing or price spikes likely
Critical Thresholds and Trigger Points:
| Inventory Level | Days Remaining at Current Drawdown | Market Response |
|---|---|---|
| 1.5 billion barrels | ~100 days | Current status; managed stress |
| 1.0 billion barrels | ~67 days | Accelerating price volatility; political pressure intensifies |
| 750 million barrels | ~50 days | Rationing discussions; major importer intervention likely |
| 500 million barrels | ~33 days | Crisis mode; economic growth forecasts downgraded globally |
| <250 million barrels | <17 days | Physical shortages in key markets; price discovery phase |
Price Scenarios (Q2 2026):
Note: The following price scenarios are analyst projections based on current market conditions and conflict duration assumptions. Actual prices will depend on diplomatic developments, demand response to higher prices, policy interventions, and unforeseen market dynamics. These should be treated as analytical scenarios rather than predictions.
| Scenario | Probability | Brent Price Range | Key Assumptions |
|---|---|---|---|
| Quick Resolution | 20% | $85–100/bbl | Diplomatic breakthrough; Hormuz reopens within 30 days |
| Base Case (Prolonged) | 50% | $120–150/bbl | Closure persists 3–4 months; reserves partially depleted |
| Escalation | 25% | $160–200/bbl | Conflict expands; Red Sea remains blocked; no resolution sighted |
| Catastrophic | 5% | $200+/bbl | Multiple chokepoints disrupted; physical shortages emerge |
3.2 Medium-Term Outlook (3–12 Months)
Supply Reconstruction Challenges: Even if the Strait reopens, full supply normalization faces significant headwinds:
- Production Restart Lag: Gulf producers have cut 10+ mb/d; restarting production infrastructure takes weeks to months
- Pipeline Infrastructure: Permanent rerouting capacity remains limited (3.5–5.5 mb/d maximum)
- Inventory Replenishment: At current drawdown rates, rebuilding strategic reserves requires 12–18 months of surplus production
- Geopolitical Risk Premium: Markets will price in elevated geopolitical risk even after physical reopening
Demand-Side Structural Changes:
- Energy Security Reassessment: Importers accelerating diversification away from Hormuz-dependent suppliers
- Strategic Reserve Policy Shifts: Countries may maintain higher reserve levels permanently post-crisis
- Renewable Energy Acceleration: Prolonged high prices could accelerate EV adoption, solar deployment, and efficiency investments
4. Conclusion & Strategic Watchpoints
The closure of the Strait of Hormuz is a systemic shock that transcends simple oil pricing; it is a test of global energy resilience. While coordinated IEA releases provide a temporary buffer, the fundamental supply gap remains critical. The primary risk is no longer just price volatility, but physical shortage in highly dependent Asian markets—specifically India and Bangladesh—where inventory levels are dangerously low.
Strategic Watchpoints for Q2 2026:
- India’s Inventory Floor: If Indian reserves drop below 15 days, expect emergency bilateral deals or drastic domestic rationing.
- The “Squeeze” Point: The window between Day 60 and Day 90 of closure is the critical phase where strategic reserves transition from “buffer” to “exhaustion.”
- Red Sea Synergy: Any resolution in Hormuz that isn’t mirrored by a reopening of the Red Sea will leave global shipping capacity severely constrained, maintaining high freight premiums.
Sources & References
- International Energy Agency (IEA) - Oil Market Report (OMR), March 2026
- U.S. Energy Information Administration (EIA) - Short-Term Energy Outlook, April 2026
- OPEC Monthly Oil Market Report, March 2026
- Reuters Commodities Analysis - “The Hormuz Chokepoint: Physical Realities” (March 15, 2026)
- Bloomberg Energy - “Strategic Reserve Depletion Models for Q2 2026”
- LSE Business Review - “Energy Security in the Indo-Pacific: The India Vulnerability”
- World Economic Forum (WEF) - “Secondary Commodity Impacts of Middle East Maritime Disruptions”
- UK Maritime Trade Operations (UKMTO) - Incident Logs, March 2026
- Maersk Logistics Report - “Global Shipping Capacity Constraints Q1-Q2 2026”
- S&P Global Commodity Insights - Brent Price Scenario Modeling
- Goldman Sachs Commodities Research - “Oil: The New Supercycle of Disruption”
- JP Morgan Energy Analysis - “LNG Spot Rate Volatility and Qatar Dependency”
- Gulf News - “Pipeline Bypass Capacity: Reality vs Projection”
- Al Jazeera - “Regional Production Curtailments in the GCC”
- Financial Times - “The 400 Million Barrel Gamble: IEA’s Largest Release”
- The Economist - “Energy Security and the End of Just-in-Time Oil”
- World Bank Commodity Markets Outlook, April 2026