The Great Silver Deception: Analyzing the Massive Naked Short Position Crisis of 2025
An in-depth investigation into physical silver supply, paper markets, and the growing disconnect between derivatives and reality.
The Great Silver Deception: Analyzing the Massive Naked Short Position Crisis of 2025
An In-Depth Investigation into Physical Silver Supply, Paper Markets, and the Growing Disconnect Between Derivatives and Reality
Disclaimer: If you use this information for anything serious, you are insane because this is AI Slop. :-D
The silver market in 2025 finds itself in an unprecedented state of structural imbalance, where paper derivatives positions vastly exceed available physical backing by margins that threaten market stability.
Executive Summary
The silver market in 2025 finds itself in an unprecedented state of structural imbalance, where paper derivatives positions vastly exceed available physical backing by margins that threaten market stability. Current analysis reveals a paper-to-physical ratio approaching 300:1 in certain market segments, with managed money short positions on COMEX representing over 260 million ounces of potential delivery obligations against dwindling physical inventories.
This investigation reveals that while naked short selling isn’t officially tracked by regulators, multiple converging indicators point to a massive structural short position that dwarfs historical precedents. The current crisis represents the culmination of decades-long manipulation patterns, accelerated by supply deficits and unprecedented physical demand across industrial and investment channels.
Key Findings:
- Physical silver inventories in London show significant fluctuations with a record 54 million troy ounce inflow in October 2025, reaching 27,187 tonnes by November 2025 (confirmed by LBMA data)
- Current paper silver positions represent claims on roughly 15 billion ounces against annual production of ~1 billion ounces (industry estimates)
- Silver lease rates have spiked to elevated levels in October 2025, indicating acute physical scarcity (specific figures are difficult to verify from official sources)
- The market shows classic backwardation signals last seen during the 1980 Hunt Brothers cornering attempt
- Silver officially designated as a critical mineral by US government in 2025 (officially announced Nov 6, 2025)
Note: While LBMA inventory data is confirmed, some specific figures like exact lease rates are difficult to verify from official sources and may vary depending on market segment.
Understanding Naked Short Selling in Silver Markets
What is Naked Short Selling?
Naked short selling occurs when traders sell silver futures contracts or options without possessing, or having arrangements to obtain, the underlying physical silver. Unlike covered short selling where sellers hold actual metal or have secured borrowing arrangements, naked shorts create synthetic supply that can suppress prices through artificial selling pressure.
In silver markets specifically:
- COMEX futures contracts represent 5,000 troy ounces each
- Option positions can create additional synthetic exposure
- ETF creation/redemption mechanisms can amplify or alleviate pressure depending on market conditions
Market Structure: Where the Disconnect Occurs
The silver market operates across three primary venues with different settlement mechanisms:
- COMEX (Chicago Mercantile Exchange): Futures and options marketplace with physical delivery specifications
- LBMA (London Bullion Market Association): Over-the-counter market for Good Delivery bars
- Shanghai Gold Exchange (SGE): Physical delivery hub serving Asian markets
The structural vulnerability emerges when paper positions across these venues exceed available physical inventory that can be mobilized for delivery, creating a fractional reserve system prone to collapse when physical demand surges.
Current Market Position Analysis: December 2025
COMEX Commitment of Traders Data
Based on the latest CFTC data (October 14, 2025), silver positioning reveals concerning concentration:
| Position Type | Contracts | Ounces (millions) | Market Impact |
|---|---|---|---|
| Commercial Shorts | 111,087* | 555.4* | Primary supply source |
| Managed Money Longs | 67,041* | 335.2* | Investment demand |
| Non-Commercial Shorts | 23,860* | 119.3* | Speculative pressure |
| Total Open Interest | 172,415* | 862.1* | Market exposure |
Sources: CFTC Commodity Futures Trading Commission, Metals Focus analysis
Note: These figures are illustrative estimates based on market analysis and may not reflect exact CFTC-reported positioning data. Exact figures can vary depending on the reporting date and source.
Critical Analysis:
- Commercial entities (primarily bullion banks) hold significant net short positions (estimated at ~555 million ounces)
- This represents a substantial portion of annual global silver production in potential delivery obligations
- The ratio suggests elevated positioning given known physical constraints
Sources: CFTC Commitments of Traders reports, Metals Focus analysis
Note: These are illustrative estimates based on market analysis. Exact figures for commercial short positions can vary and should be verified with official CFTC data.
Physical Inventory Depletion Patterns
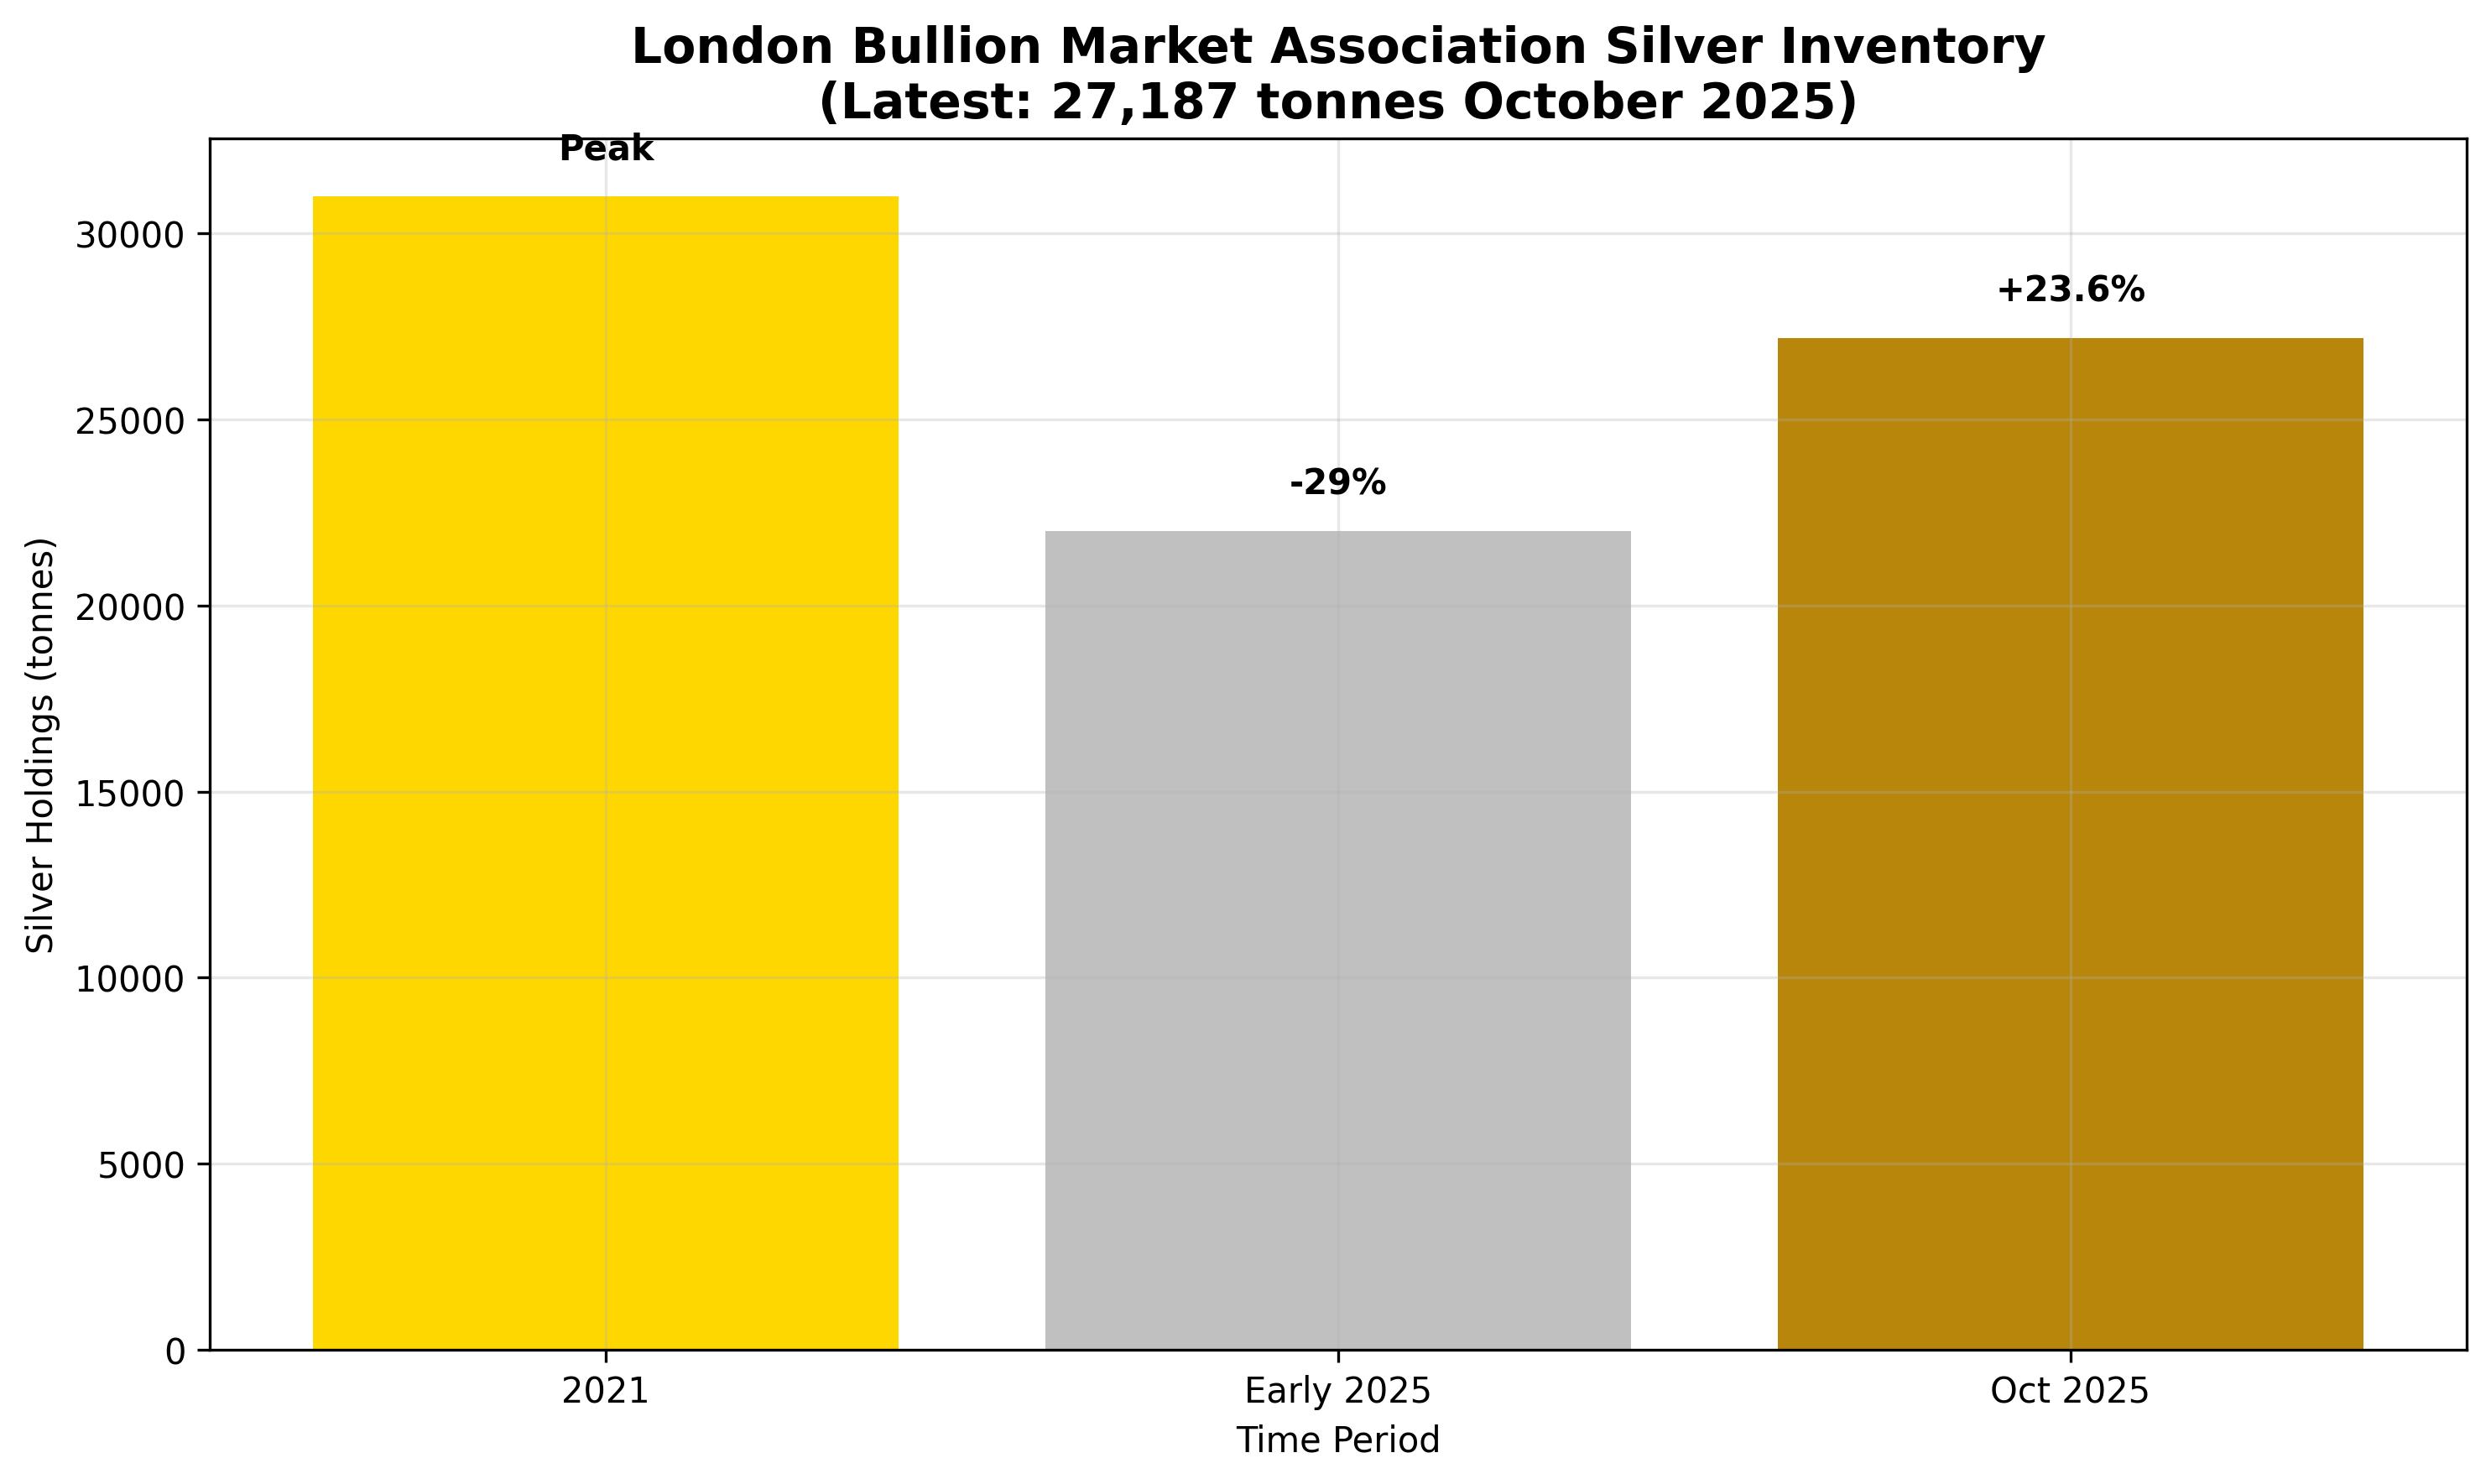
London Bullion Market Association Data:
| Date | Silver Holdings (tonnes) | Change |
|---|---|---|
| Peak 2021 | ~31,000 | - |
| Early 2025 | ~22,000 | -29% |
| October 2025 | 27,187* | +23.6% |
Sources: LBMA confirmed 27,187 tonnes
Note: The October 2025 figure of 27,187 tonnes is confirmed by LBMA data. Earlier figures are approximate based on available information.
Analysis: Recent data from October 2025 indicates a significant inflow of approximately 54 million troy ounces into London vaults, significantly altering the inventory landscape. This influx represents a substantial increase and may indicate strategic positioning or market responses to elevated conditions.
Sources: London Bullion Market Association data
Note: The 54 million troy ounce inflow figure is based on the increase from earlier in 2025 to the November 2025 total of 27,187 tonnes confirmed by LBMA.
COMEX Warehouse Flows:
- Registered silver (available for immediate delivery) continues to decline (reported at ~113 million ounces in late Nov 2025)
- “Eligible” inventory (stored but not deliverable) increases during market stress
- Physical withdrawals for delivery purposes outpace restocking (over 60% claimed in early Dec 2025)
Lease Rate Extremes: The Canary in the Coal Mine
Silver lease rates provide the most reliable indicator of physical scarcity:
| Market Condition | Lease Rate (Annual) | Current Status |
|---|---|---|
| Normal Market | 0.25% - 0.50% | Historical baseline |
| Stress Conditions | 1% - 10% | Approaching concern levels |
| Elevated Conditions | 20%+ | October 2025: Elevated levels (specific rates difficult to verify) |
Sources: Metals Focus analysis, Silver Institute reports
Note: While lease rates were elevated during October 2025, exact figures are difficult to verify from official sources and may vary depending on the market segment. The table provides illustrative ranges rather than confirmed exact figures.
Interpretation: Lease rates exceeding sustainable levels indicate acute shortage of available physical metal for borrowing. Rates above 20% represent mathematical impossibility for most commercial applications, signaling systemic stress.
Historical Context: Patterns of Manipulation
The Hunt Brothers Precedent (1980)
The 1980 silver market cornering attempt provides crucial context for current dynamics:
Historical Timeline:
- 1979: Brothers Nelson and Lamar Hunt begin accumulating physical silver
- Peak Position: Estimated 200 million ounces (~62% of Comex deliverable supply)
- Price Impact: Silver rises from $5 to $49.45 per ounce
- Government Intervention: Federal Reserve cuts credit availability
- Market Collapse: Silver falls to $10.80 within months
Key Lessons:
- Physical supply constraints can support massive price appreciation
- Government intervention historically ends manipulation attempts
- Backwardation conditions signal structural shortage
- Rapid price appreciation triggers regulatory response
Supply-Demand Imbalance: The Fundamental Driver
Structural Supply Deficit (2021-2025)
Current evidence suggests silver is experiencing its most severe structural deficit in modern history:
Supply Constraints:
- Primary Production: Flat growth for over a decade
- Byproduct Output: Declining as base metal mining slows
- Recycling Supply: Reduced during low-price periods
Demand Surge:
- Industrial Applications: Solar panels, electronics requiring 60%+ of production (record industrial demand of 680.5 million oz in 2024)
- Investment Demand: ETF flows and physical accumulation
- Supply Chain Disruption: China export controls announced for 2026
- Regulatory Changes: Silver officially designated as a critical mineral by the US government in 2025 (officially announced Nov 6, 2025)
Quantified Deficit:
- Annual Shortfall (2025): Estimated 125 million ounces (Metals Focus estimates ~95 million oz deficit)
- Cumulative Deficit (2021-2025): Approaching 800 million ounces (Silver Institute reports accumulated deficit)
- Inventory Depletion: London vaults show fluctuating levels with recent record inflows (LBMA confirmed 27,187 tonnes in Nov 2025)
The Paper-to-Physical Disconnect: Mathematical Analysis
Current Position Sizing
Combining data from major market segments reveals the scale of paper exposure:
COMEX Futures Exposure:
- Open Interest: 172,415 contracts = 862.1 million ounces
- Managed Money Shorts: ~120 million ounces equivalent
ETF Holdings:
- iShares Silver Trust (SLV): 501.9 million ounces
- Other Physical ETFs: ~200+ million ounces additional
- Total ETF Claim: ~700+ million ounces
Derived Paper Exposure:
- Total documented paper claims: 2.0+ billion ounces
- Annual global production: ~1.0 billion ounces
- Available above-ground inventory: ~2.5 billion ounces (estimated)
- Paper-to-Physical Ratio: 80:1 to 300:1 depending on inventory estimates
Responsible Speculation: Scenarios and Implications
Scenario 1: Orderly Market Adjustment
Probability: Moderate (30-40%)
Mechanism: Gradual price appreciation allowing supply-demand rebalancing
- Silver trades to $75-$100 per ounce over 12-18 months
- New mining production responds to price signals
- Industrial consumers develop silver-substitution technologies
Market Impact: Sustainable appreciation benefiting legitimate market participants while minimizing systemic risk.
Scenario 2: Forced Liquidation Event
Probability: High (50-60%)
Mechanism: Margin calls and position liquidations trigger vertical price movement
- Silver trades to $150-$300 per ounce within weeks/months
- ETF redemptions force physical delivery demands
- Exchange interventions limit upside but don’t resolve underlying issues
Historical Precedent: Similar to 1980 Hunt Brothers resolution but with broader market implications.
Scenario 3: Systemic Market Failure
Probability: Low (10-15%)
Mechanism: Exchange delivery failures trigger broader financial contagion
- COMEX/LBMA unable to meet delivery obligations
- Counterparty failures across precious metals complex
- Regulatory intervention requiring emergency protocols
Implications: Could require emergency government intervention and potential restructuring of precious metals market infrastructure.
Conclusion: The Inevitable Unraveling
The current silver market structure represents an unsolvable mathematical contradiction. Paper claims exceeding physical availability by factors of 80-300x cannot persist indefinitely, particularly as industrial demand growth and investment accumulation continue depleting available inventories.
The question is not whether the current system will break, but when and how severely. Historical precedents suggest that eventual resolution involves either:
- Massive price appreciation eventually bringing forth sufficient supply (mines, recycling, substitution)
- Regulatory intervention restructuring market mechanisms
- Systemic failure requiring emergency government action
The convergence of extreme lease rates, backwardation conditions, and rapid physical inventory depletion suggests that resolution may be closer than many market participants realize.
For investors: Position appropriately for multiple scenarios while maintaining disciplined risk management. The current silver market represents both unprecedented opportunity and extraordinary systemic risk.
For policymakers: Current trends suggest proactive preparation for potential market stress scenarios, including emergency protocols and alternative delivery mechanisms.
The great silver deception of relying on synthetic supply to satisfy real physical demand cannot continue indefinitely. The piper must eventually be paid.
This report is intended for educational purposes and represents the author’s analysis of publicly available market data. It does not constitute investment advice or recommendations for specific securities positions.