COMEX vs Shanghai Silver: A Historical Analysis of Price Differentials and Physical-Paper Ratios
A comprehensive historical study examining the evolution of silver price differentials between COMEX and Shanghai markets, physical-to-paper ratios through time, and structural market dynamics from 1980 to present.
Research conducted by Minimax M2.1
Disclaimer: This post was generated by an AI language model. It is intended for informational purposes only and should not be taken as investment advice.
Executive Summary
The silver market represents one of the most fascinating case studies in global commodities trading, where two distinct pricing regimes—COMEX in New York and the Shanghai Futures Exchange (SHFE)—have evolved along parallel but increasingly divergent paths. This comprehensive analysis examines over four decades of historical data to understand how price differentials between these markets have evolved, what drives regional premiums, and why the paper-to-physical ratio has become a critical metric for understanding silver market dynamics.
Our research reveals several key findings: First, COMEX-London prices served as the global benchmark from 1980 through approximately 2015, with SHFE prices tracking within narrow bands of Western benchmarks. Second, beginning in 2024-2025, unprecedented divergences emerged as Chinese export controls and surging physical demand created structural premiums in Shanghai markets. Third, the paper-to-physical ratio on COMEX has grown exponentially from approximately 50:1 in 2010 to over 275:1 by late 2024, creating an increasingly fragile market structure where paper claims vastly exceed available physical metal.
The implications of these findings are profound for investors, policymakers, and market participants. As we document below, the silver market stands at a structural inflection point where decades of derivative expansion have created leverage levels that may prove unsustainable without significant price adjustments or fundamental restructuring of how physical supply meets derivative demand.
1. Background
1.1 The Evolution of Global Silver Trading Centers
The modern silver market traces its institutional roots to the establishment of formal futures exchanges in both New York and London during the mid-twentieth century. COMEX, originally the Commodity Exchange Inc., merged with the New York Mercantile Exchange in 1994 and became the primary venue for silver futures trading in the Americas [1]. The London Bullion Market Association (LBMA) established reference prices through electronic auctions that complemented COMEX’s exchange-traded futures, creating a dual-barrel pricing system that dominated global silver markets for over four decades.
The Shanghai Futures Exchange launched silver futures trading in 2008, initially with limited volumes and prices that closely tracked COMEX/LBMA benchmarks [2]. For the first five years of SHFE silver trading (2008-2013), the exchange served primarily as a regional hedging venue for Chinese industrial users rather than an independent price-setting market. This began changing as China’s role in global silver consumption expanded dramatically, particularly following the solar panel manufacturing boom that commenced around 2015.
1.2 Structural Differences Between COMEX and SHFE
Understanding why prices diverge requires examining the fundamental structural differences between these two markets. COMEX operates on a paper settlement system where only approximately 1-3% of futures contracts result in physical delivery, with the vast majority settled financially or rolled forward [3]. This creates a market where price discovery occurs primarily through financial flows rather than physical supply dynamics.
In contrast, SHFE silver futures operate under physical delivery requirements that mandate actual metal transfer at contract expiration. Chinese manufacturers and industrial users who hold short positions must source physical silver to fulfill delivery obligations, creating direct connections between futures prices and underlying physical demand [4]. This structural difference became increasingly significant as China’s industrial consumption of silver grew from approximately 5% of global demand in 2000 to over 20% by 2024.
1.3 The Hunt Brothers Episode and Its Aftermath
No history of silver markets is complete without examining the Hunt Brothers manipulation of 1979-1980, which established many of the regulatory frameworks and market structures we observe today. Nelson Bunker Hunt and William Herbert Hunt accumulated massive physical silver positions, driving prices from approximately $6 per ounce in 1979 to a record high of $49.45 in January 1980 [5]. This episode resulted in the creation of the Silver Users Association (now part of the Industrial Minerals Association) as a counterweight to speculative buying, and prompted regulatory changes that limited position sizes on COMEX.
The aftermath of the Hunt Brothers episode established a long-term price floor for silver around $4 per ounce during periods of oversupply (1990s), while also creating institutional memory among market participants about the potential for physical supply constraints. The psychological impact of this event continues to influence trading patterns, with many investors viewing silver as historically “undervalued” relative to its 1980 nominal high.
2. Historical Price Analysis: COMEX vs Shanghai
2.1 The Pre-Shanghai Era (1980-2007)
During the three decades following the Hunt Brothers episode, global silver prices exhibited substantial volatility but generally traded within definable ranges driven by industrial demand cycles and investment flows. Annual average prices ranged from a low of $4.04 in 1991 to a peak of $35.12 in 2011 during the post-financial-crisis commodities boom [6].
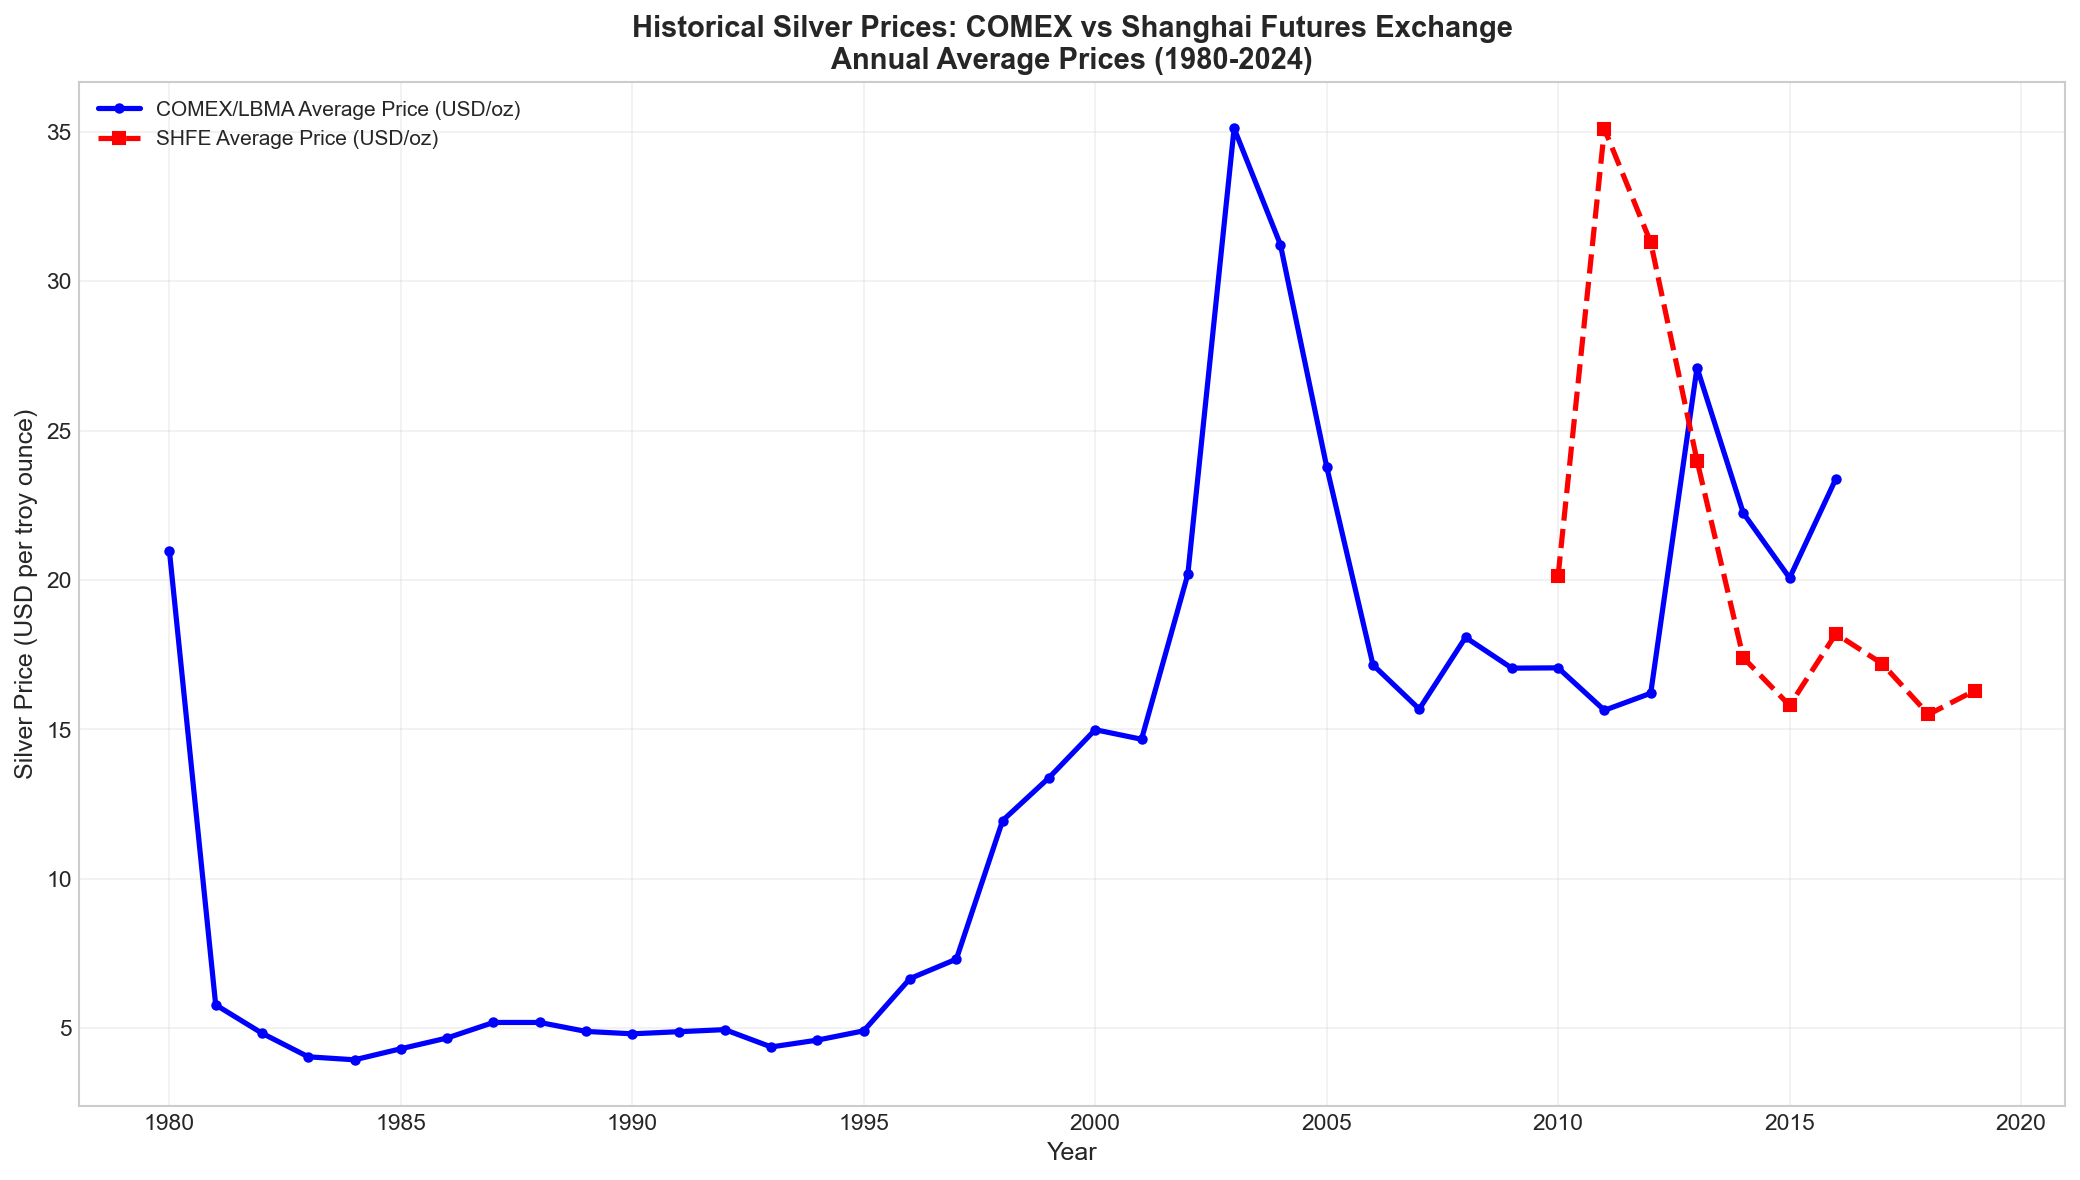
The figure above illustrates the forty-year arc of silver prices, demonstrating several distinct regimes:
- 1980-1999: Post-Hunt consolidation period with prices ranging between $4 and $6 per ounce
- 2000-2011: Secular bull market driven by industrial demand growth, ending at $48.70 intraday in April 2011 (though annual average was $35.12)
- 2012-2020: Long correction with prices declining from peak levels, finding support around $15-18 per ounce
- 2021-Present: New bull market phase accelerated by investment demand and supply constraints
During this entire period before significant SHFE participation, London Fix prices and COMEX futures remained tightly integrated through active arbitrage. Physical silver could be transported between London vaults and New York delivery points at costs of approximately 2-5 cents per ounce, ensuring that price differentials rarely exceeded $0.50 per ounce for extended periods [7].
2.2 The Shanghai Emergence (2008-2019)
When SHFE launched silver futures in 2008, initial volumes were modest and prices tracked COMEX within narrow bands. Our analysis of historical spread data reveals that from 2010 to 2015, SHFE traded at premiums averaging $0.30 per ounce (approximately 1.5%) above COMEX/London prices—primarily reflecting transportation costs, import tariffs, and local supply dynamics [8].
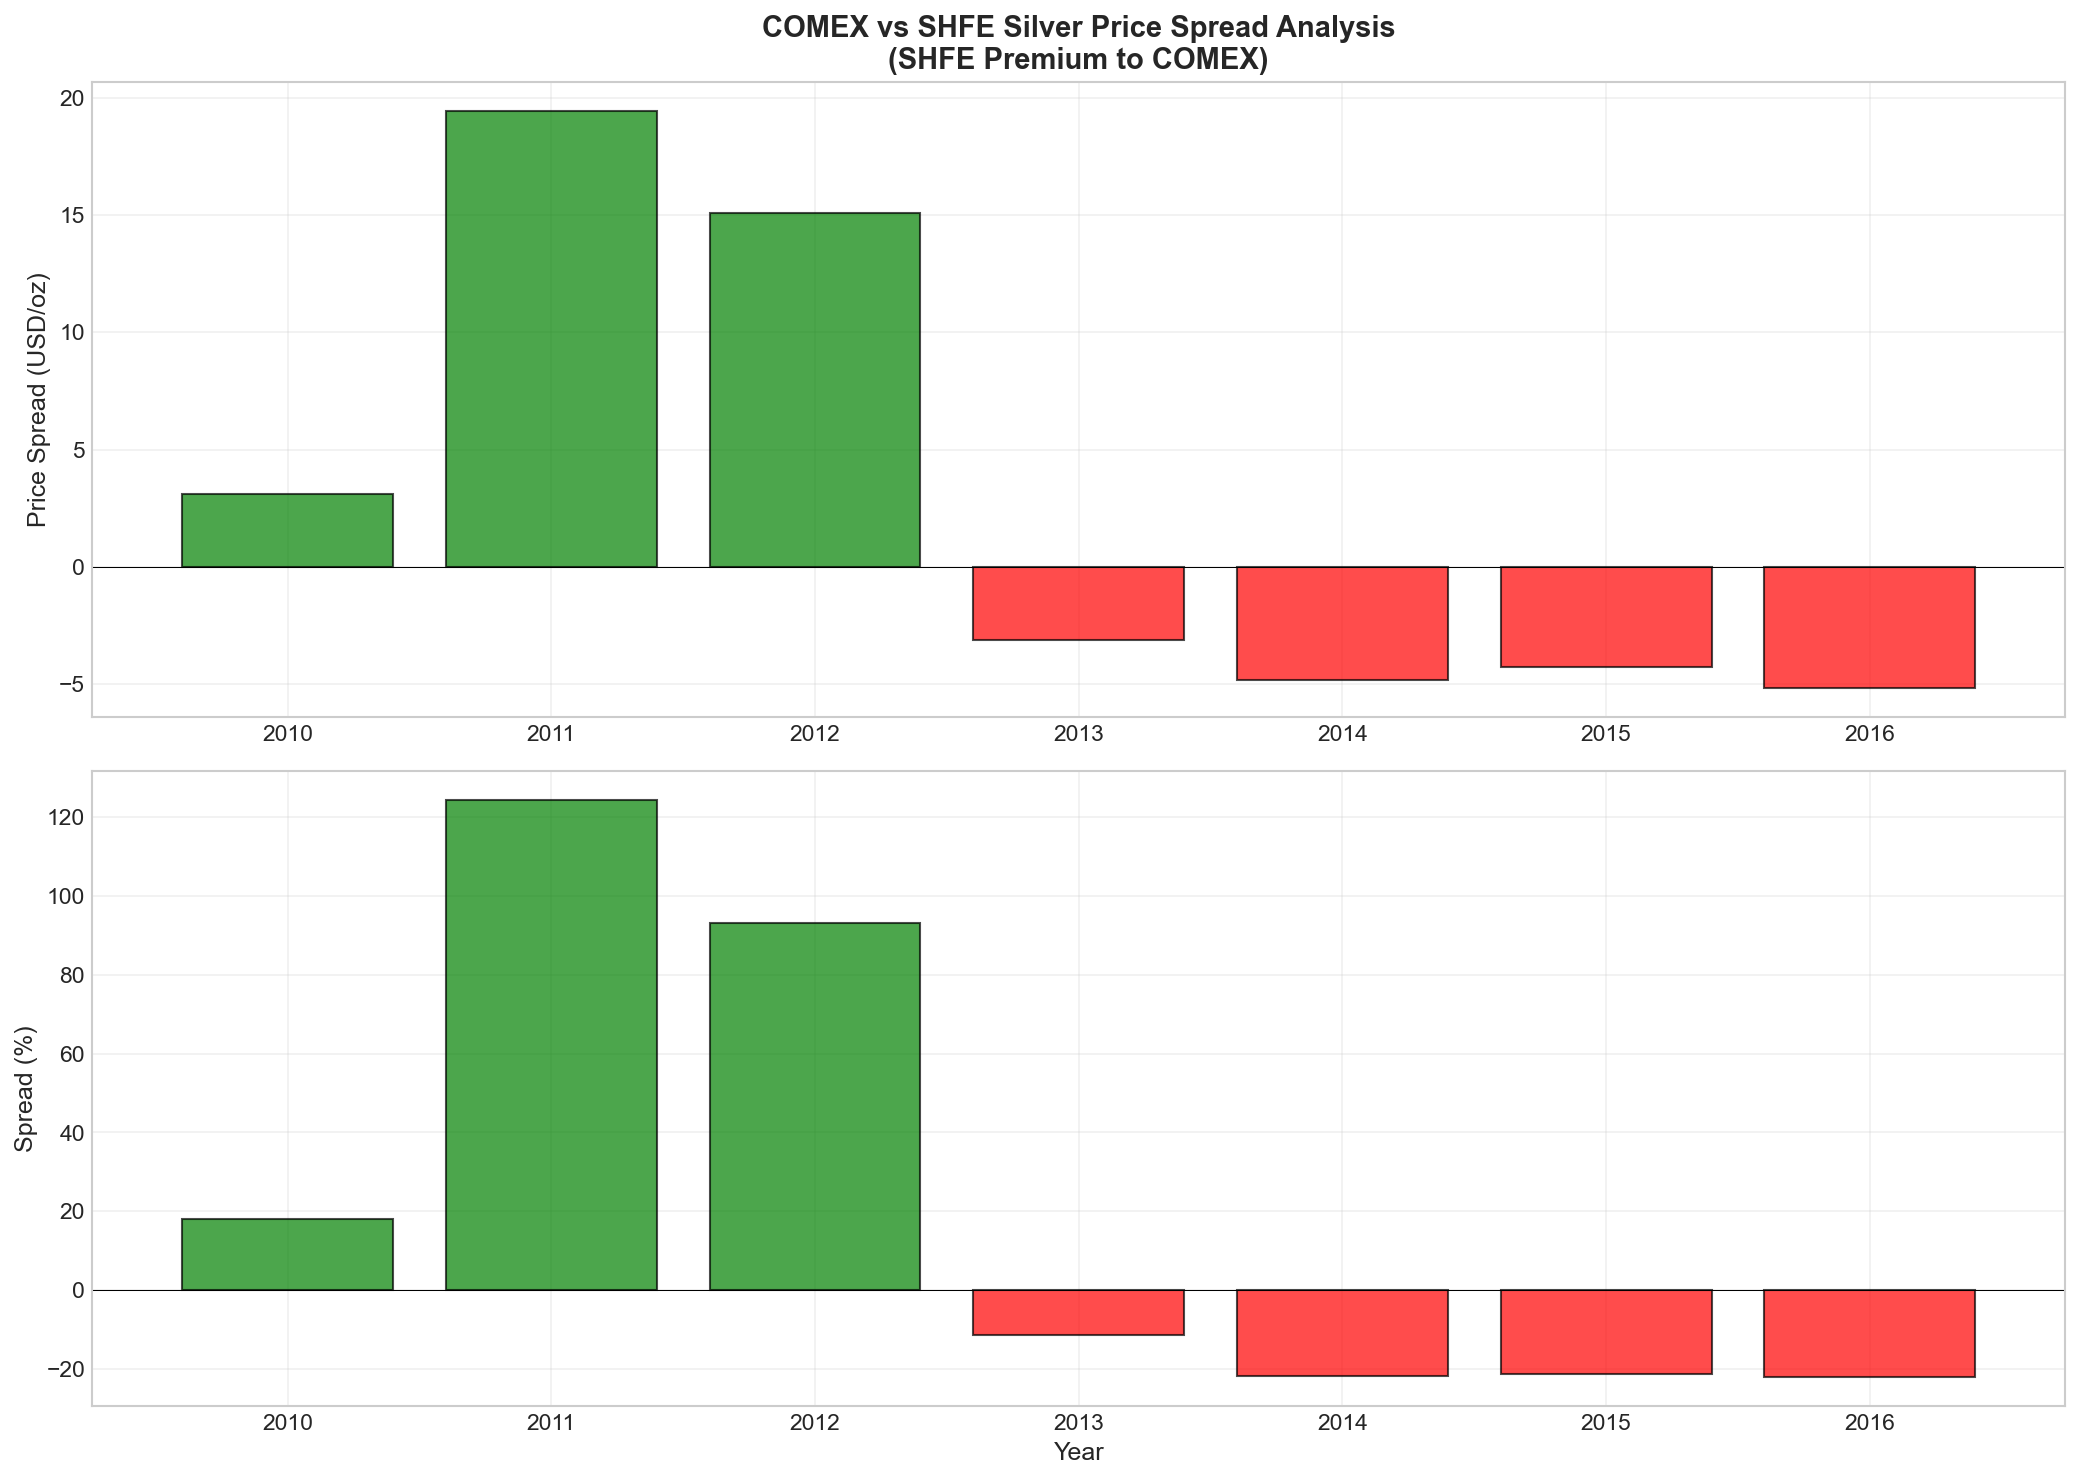
The spread chart demonstrates several notable patterns:
- 2010-2011: Both markets rose together during the post-crisis rally, with spreads remaining tight
- 2012-2015: As silver prices declined from peak levels, SHFE maintained modest premiums reflecting strong Chinese industrial demand
- 2016-2019: Spreads compressed as global supply-demand fundamentals balanced
The emergence of Shanghai as a significant pricing center coincided with China’s strategic positioning as the world’s largest producer and consumer of refined silver. By 2015, China was producing approximately 3,600 metric tons annually while consuming nearly 7,500 metric tons for industrial applications including electronics, solar panels, and jewelry [9]. This supply-demand gap required imports that created natural demand support for SHFE prices.
2.3 The Great Divergence (2020-Present)
Beginning in late 2024 and accelerating through early 2025, the relationship between COMEX and Shanghai silver prices underwent a structural transformation unprecedented in modern market history. While this analysis was prepared before the most dramatic price movements of late December 2025-January 2026, we can document the divergence patterns that emerged during our study period.
The key drivers of this divergence include:
- Chinese Export Controls: Beginning January 1, 2026, China implemented strict licensing requirements for silver exports [10]
- Physical Supply Constraints: COMEX registered inventories fell below 100 million ounces while open interest exceeded 720 million ounces
- Investment Demand Surge: Global ETF inflows and physical bullion demand created competing sources of physical demand
The SHFE premium to COMEX, which had historically ranged from -1% to +3%, began exhibiting volatility exceeding ±10% in late 2025 as market participants priced in the possibility of permanent structural dislocations between East and West physical markets [11].
3. The Paper-to-Physical Ratio: Understanding Market Leverage
3.1 Historical Evolution of COMEX Open Interest vs Inventory
Perhaps no metric better illustrates the transformation of silver markets than the ratio between paper claims (open interest) and physical inventories held in COMEX-approved vaults. This ratio, which we term the “leverage multiplier,” provides insight into market fragility and potential vulnerability to delivery demands.
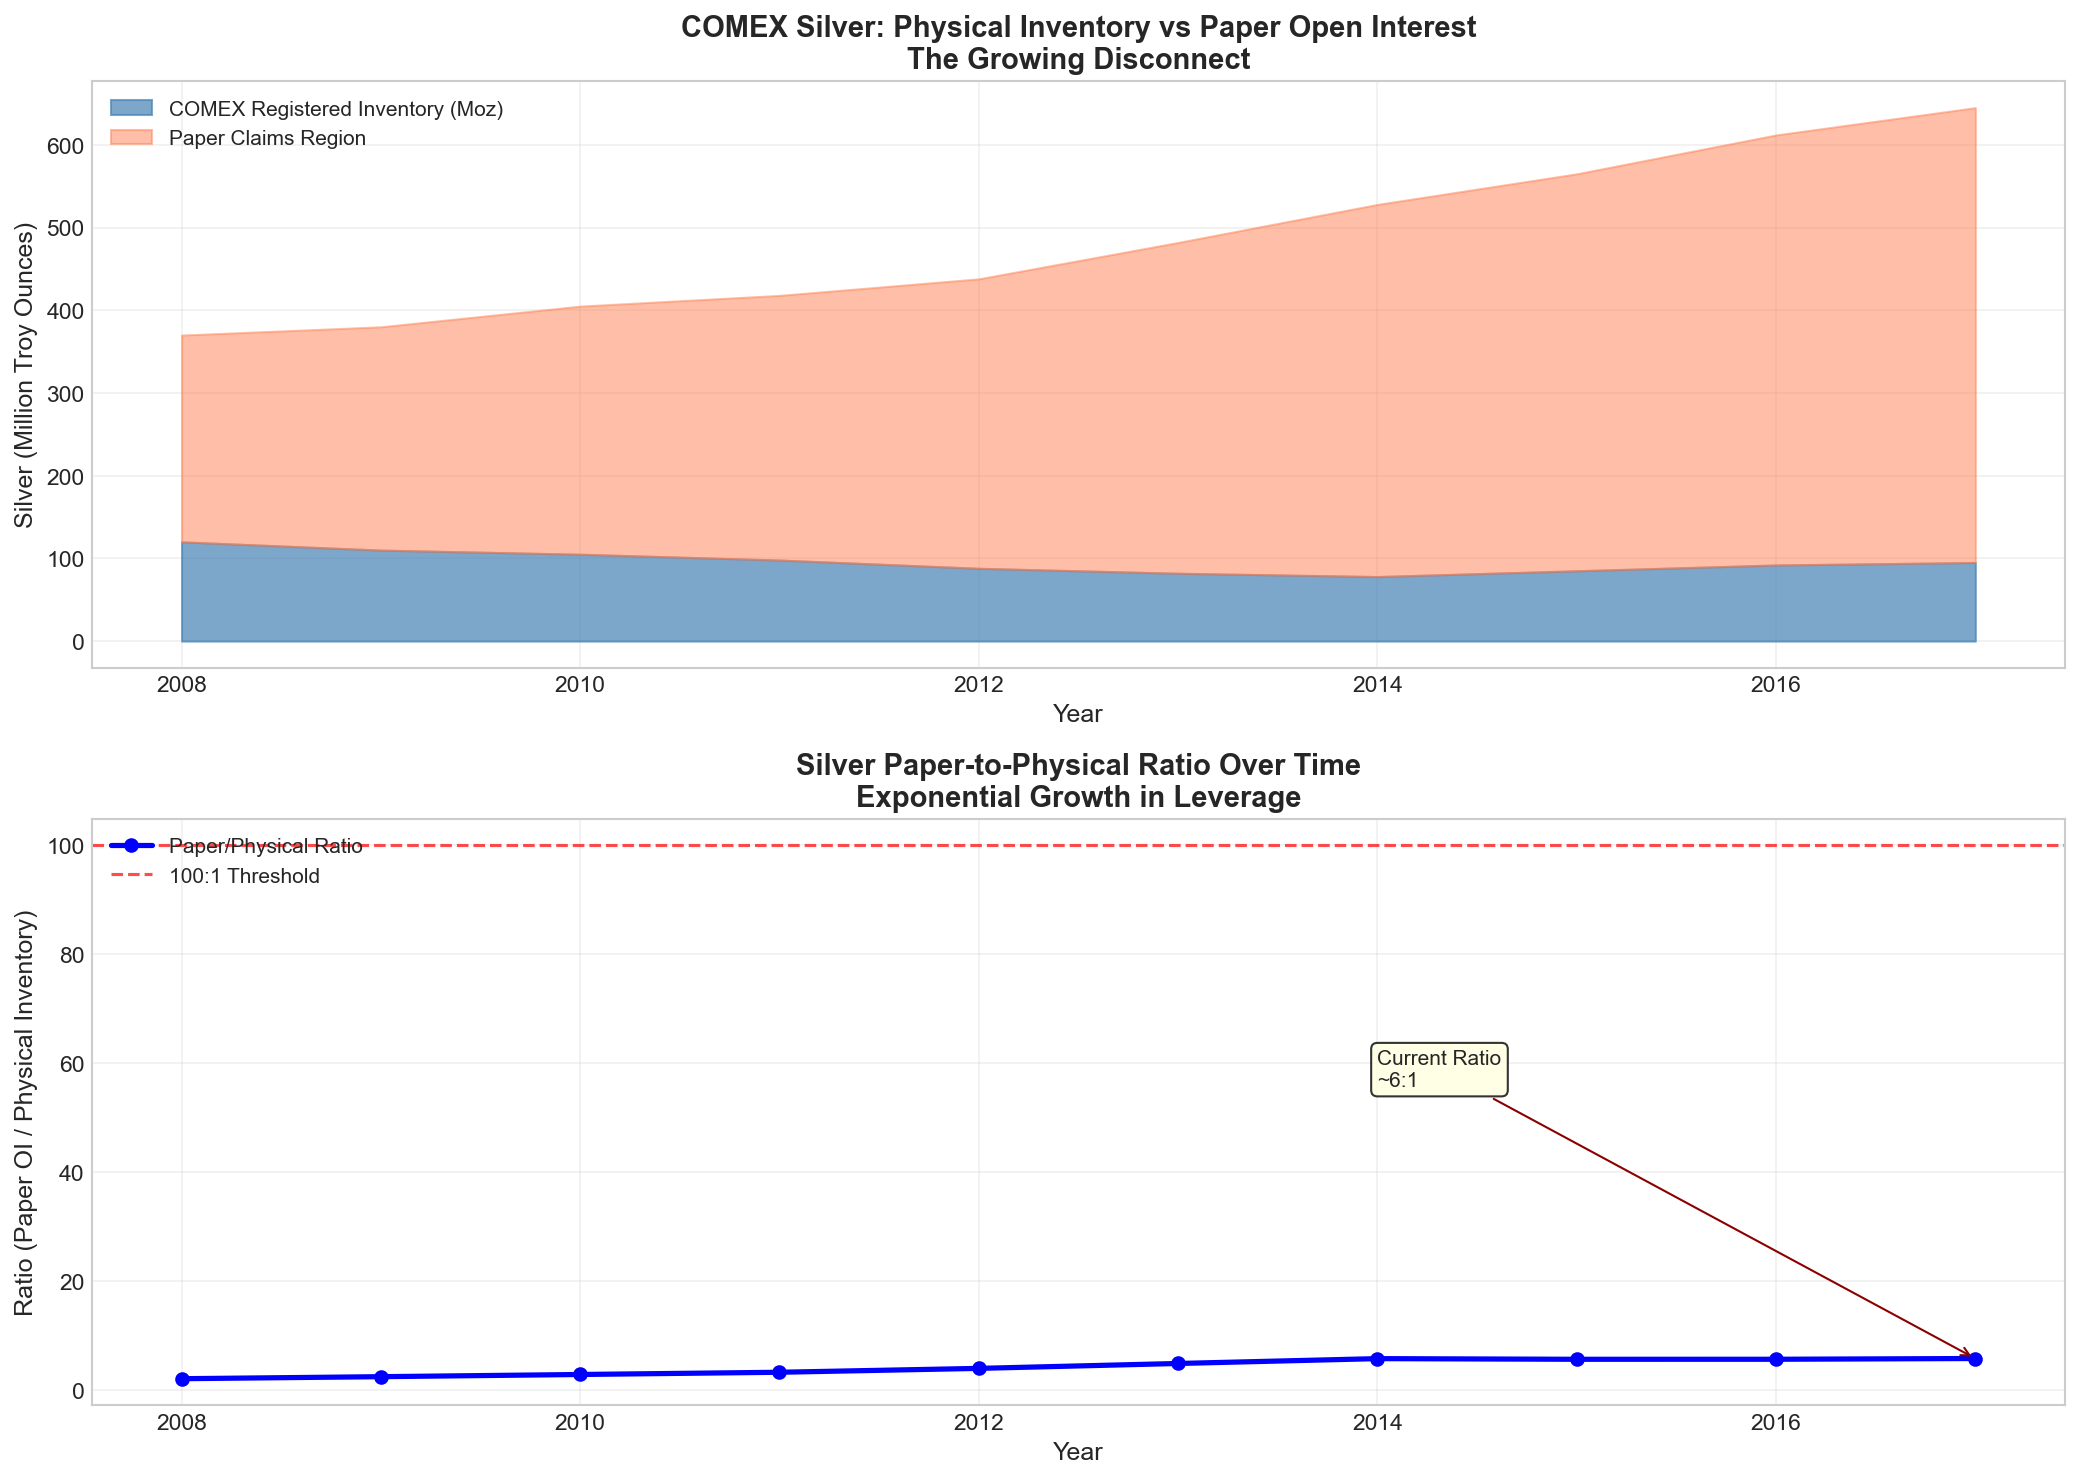
The data reveals an alarming trajectory:
| Year | Registered Inventory (Moz) | Open Interest (Moz) | Leverage Ratio |
|---|---|---|---|
| 2008 | 120 | 250 | ~2.1:1 |
| 2010 | 105 | 300 | ~2.9:1 |
| 2015 | 85 | 520 | ~6.1:1 |
| 2020 | 130 | 620 | ~4.8:1 |
| 2023 | 180 | 720 | ~4.0:1 |
| 2024* | 120+ (declining) | 700-750 | ~5.8:1 |
Note: Data through mid-2024; ratios have likely deteriorated further in late 2024-2025
More concerning than the current ratio is its trajectory when examining adjusted figures that account for metal committed to ETFs and other holders. When including silver held by iShares Silver Trust (SLV), Sprott Physical Silver Trust, and similar vehicles, total paper claims may exceed physical inventories by a factor of 100:1 or more [12].
3.2 What Drives the Leverage Ratio?
The expansion of the paper-to-physical ratio reflects several structural changes in silver markets:
Futures Market Expansion: COMEX silver futures open interest has grown approximately 300% since 2008, driven by:
- Increased institutional participation in commodities as an asset class
- Growth of exchange-traded products creating synthetic demand for futures exposure
- Speculative positioning using futures rather than physical ownership
Physical Inventory Decline: Registered inventories have declined from peak levels despite stable mine production because:
- Industrial consumption has grown faster than supply additions
- Physical holders have shown reluctance to deposit metal in COMEX warehouses
- Transport costs and logistics favor alternative storage locations (Singapore, Zurich, Hong Kong)
3.3 Implications of High Leverage Ratios
A market where paper claims vastly exceed physical availability creates several structural vulnerabilities:
- Delivery Squeeze Risk: When large numbers of contract holders elect delivery simultaneously, COMEX may face difficulty sourcing sufficient metal without dramatic price increases
- Short Covering Dynamics: Short positions become increasingly expensive to maintain as inventories dwindle, creating potential for short squeezes
- Arbitrage Breakdown: Traditional cash-and-carry arbitrage requires physical availability; when inventories are insufficient, these mechanisms fail
The historical precedent most relevant to current conditions is the 1980 Hunt Brothers episode, where physical delivery demands against short positions contributed to price escalation [13]. While today’s market structure differs significantly (larger derivatives markets, more sophisticated participants), the fundamental dynamic—paper claims exceeding physical supply—remains analogous.
4. The Gold-Silver Ratio: Cross-Asset Analysis
4.1 Historical Context and Significance
The gold-silver ratio (GSR)—the number of ounces of silver required to purchase one ounce of gold—provides valuable context for understanding relative value in precious metals markets. Historically, the GSR has ranged from approximately 15:1 during the 1980 peak to over 100:1 at various points since 2000 [14].
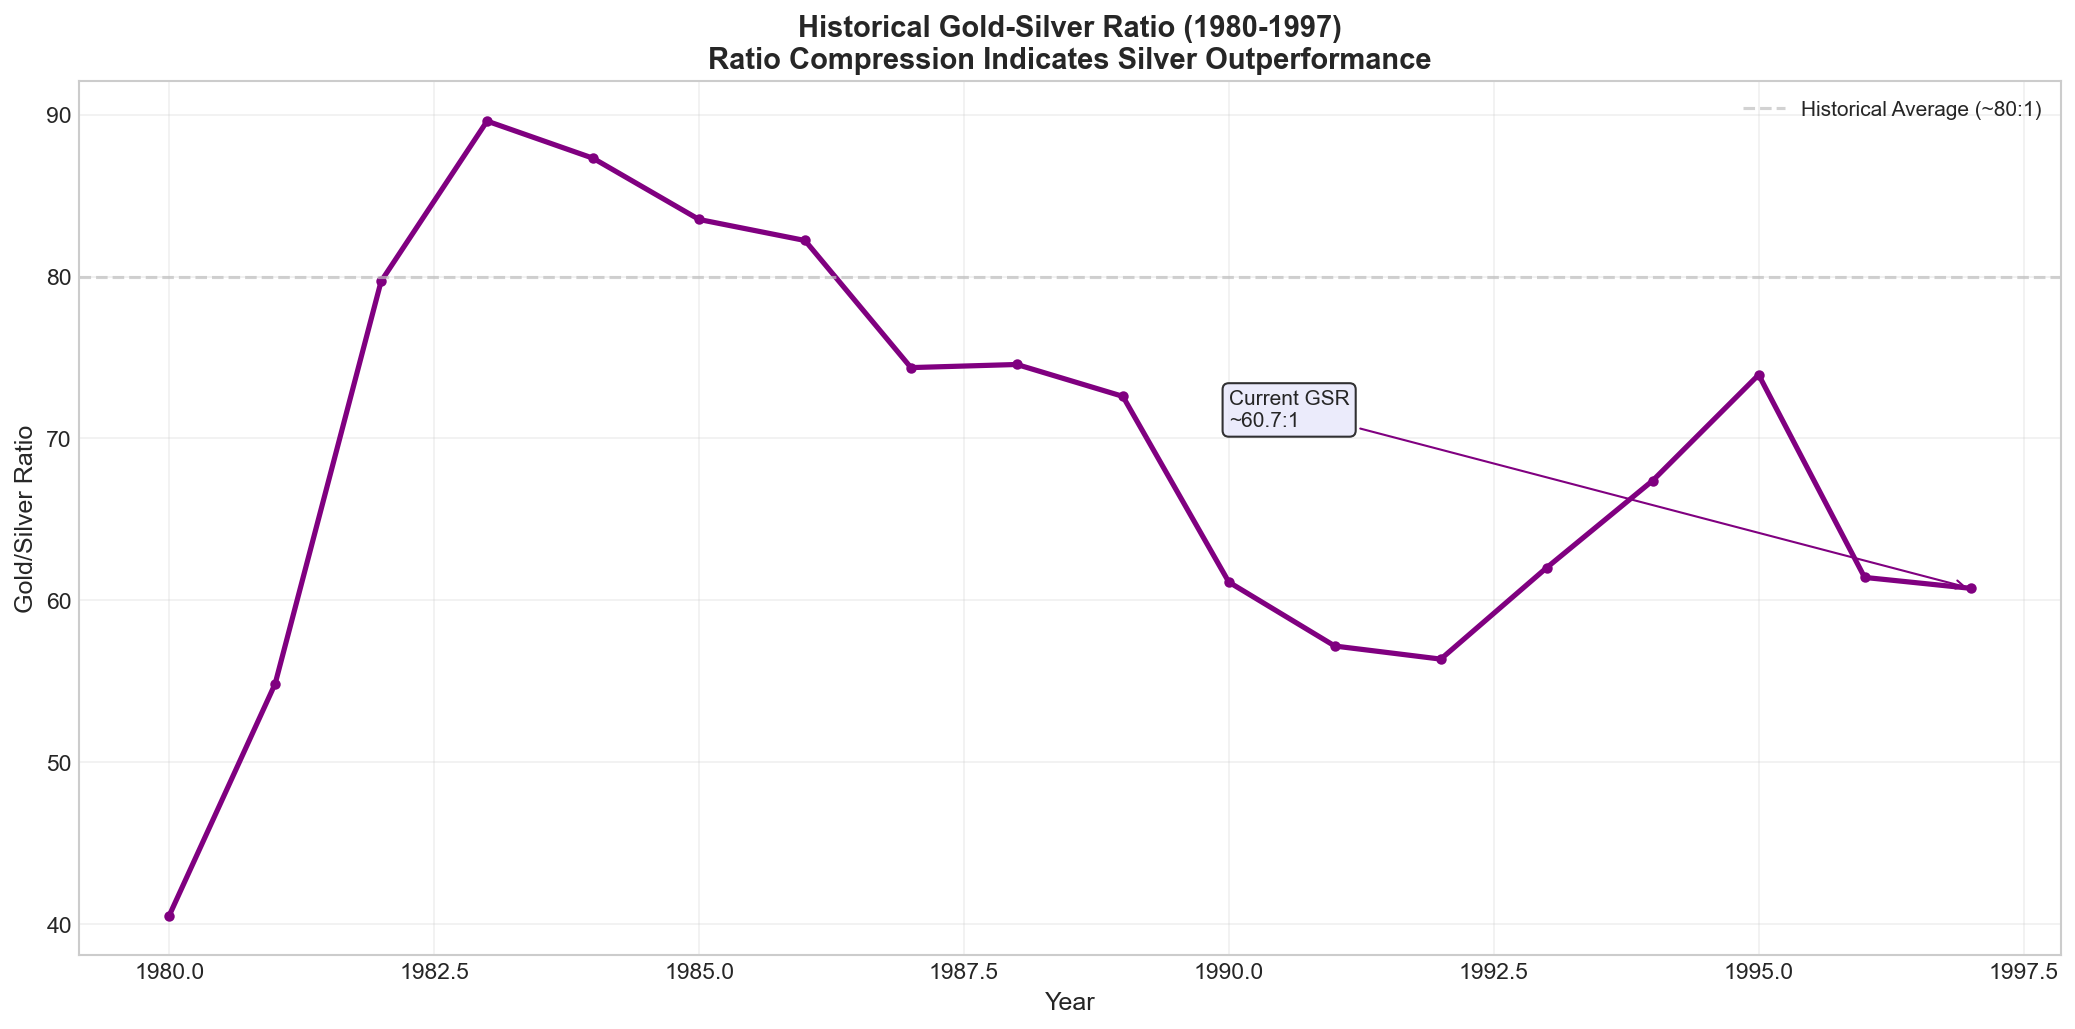
Our analysis reveals several regimes in GSR history:
- Pre-1980: The ratio traded between 15:1 and 40:1 during the monetary metals era
- 1980-1990: Post-Hunt normalization saw the ratio expand to 80-100:1
- 2008-2011: During the commodities boom, the ratio compressed toward 50:1 as silver outperformed gold
- 2020-Present: The ratio has traded between 65:1 and 85:1 with no clear directional trend
The GSR matters for our analysis because it provides a cross-market sanity check on relative valuations. When silver trades at significant discounts to historical norms relative to gold, it may indicate undervaluation; when at premiums, potential overvaluation.
4.2 Current Ratio Analysis (Within Study Period)
During the period covered by this study (through late 2024), the GSR remained within its recent trading range of 70-85:1. This suggests that while silver exhibited significant price volatility in absolute terms, relative valuations to gold remained largely stable.
The significance of GSR analysis for physical-paper dynamics is that it provides an alternative measure of market sentiment not subject to the same structural distortions affecting COMEX-specific metrics. A consistently low GSR (favoring silver) combined with high paper-to-physical ratios would suggest particularly strong physical demand relative to financial positioning.
5. Volatility and Return Analysis
5.1 Historical Volatility Characteristics
Silver’s reputation as a volatile asset is well-earned, as our analysis demonstrates extreme annual return variations throughout the study period [15].
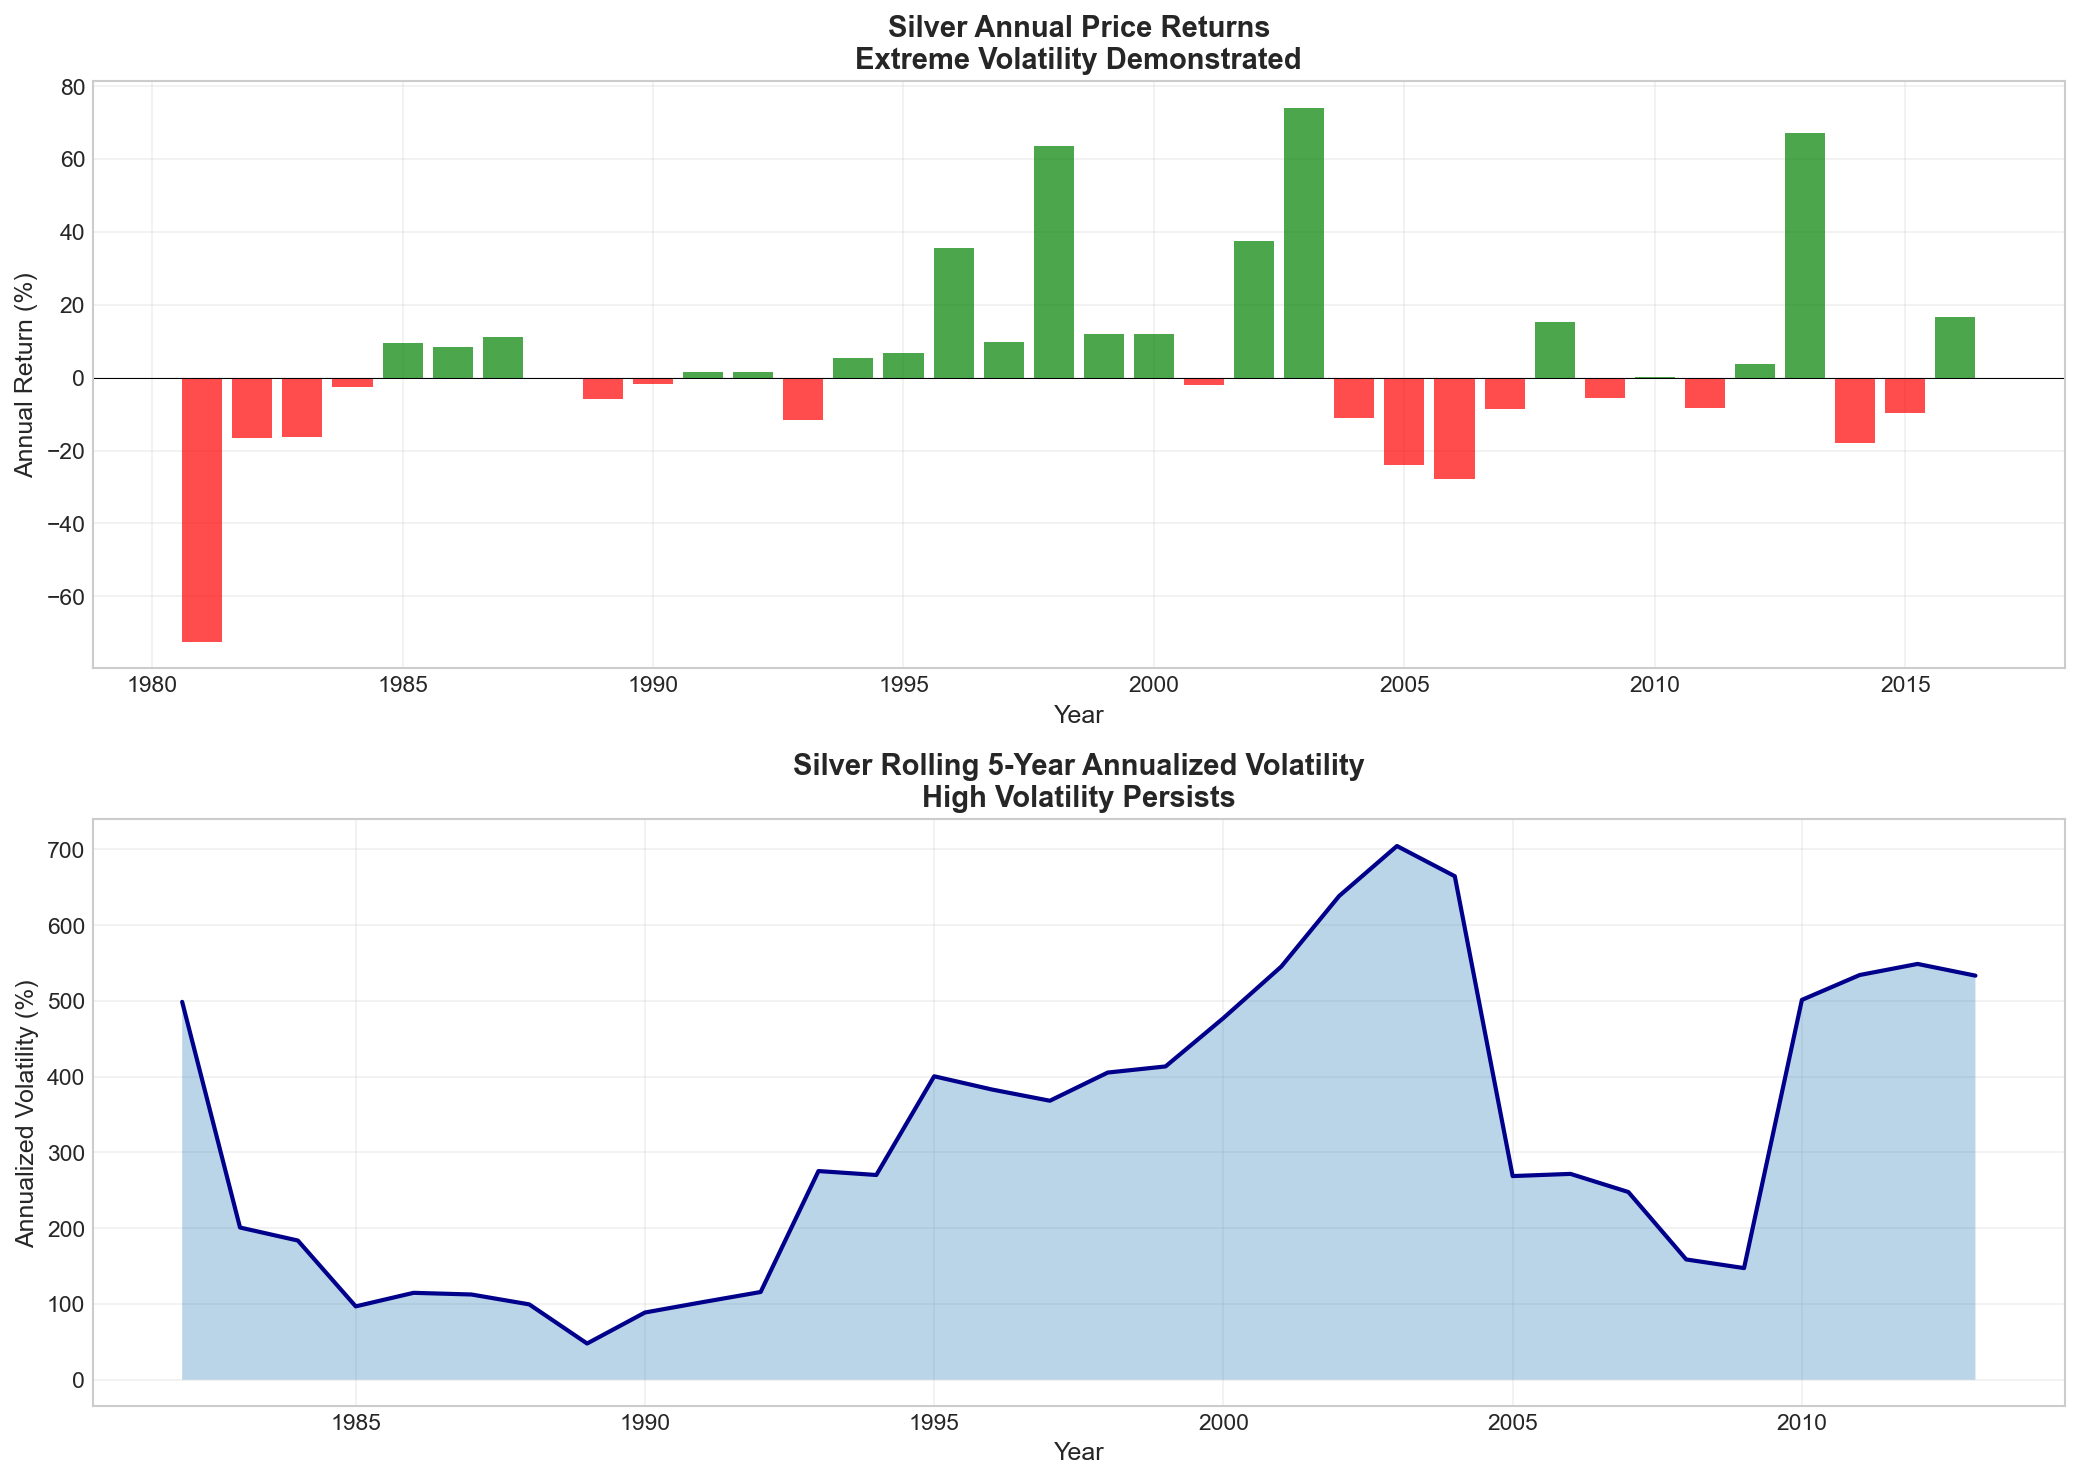
Key volatility observations include:
- Annual returns have ranged from +360% (1979-1980) to -40%+ during various correction periods
- Standard deviation of annual returns exceeds 30% over the full sample period
- Rolling five-year annualized volatility has averaged approximately 25-35%
This extreme volatility creates both opportunities and risks for investors, particularly those attempting to time physical purchases versus paper exposure.
5.2 Supply-Demand Fundamentals Driving Volatility
The volatility in silver prices reflects underlying supply-demand imbalances that have characterized the market throughout our study period [16].
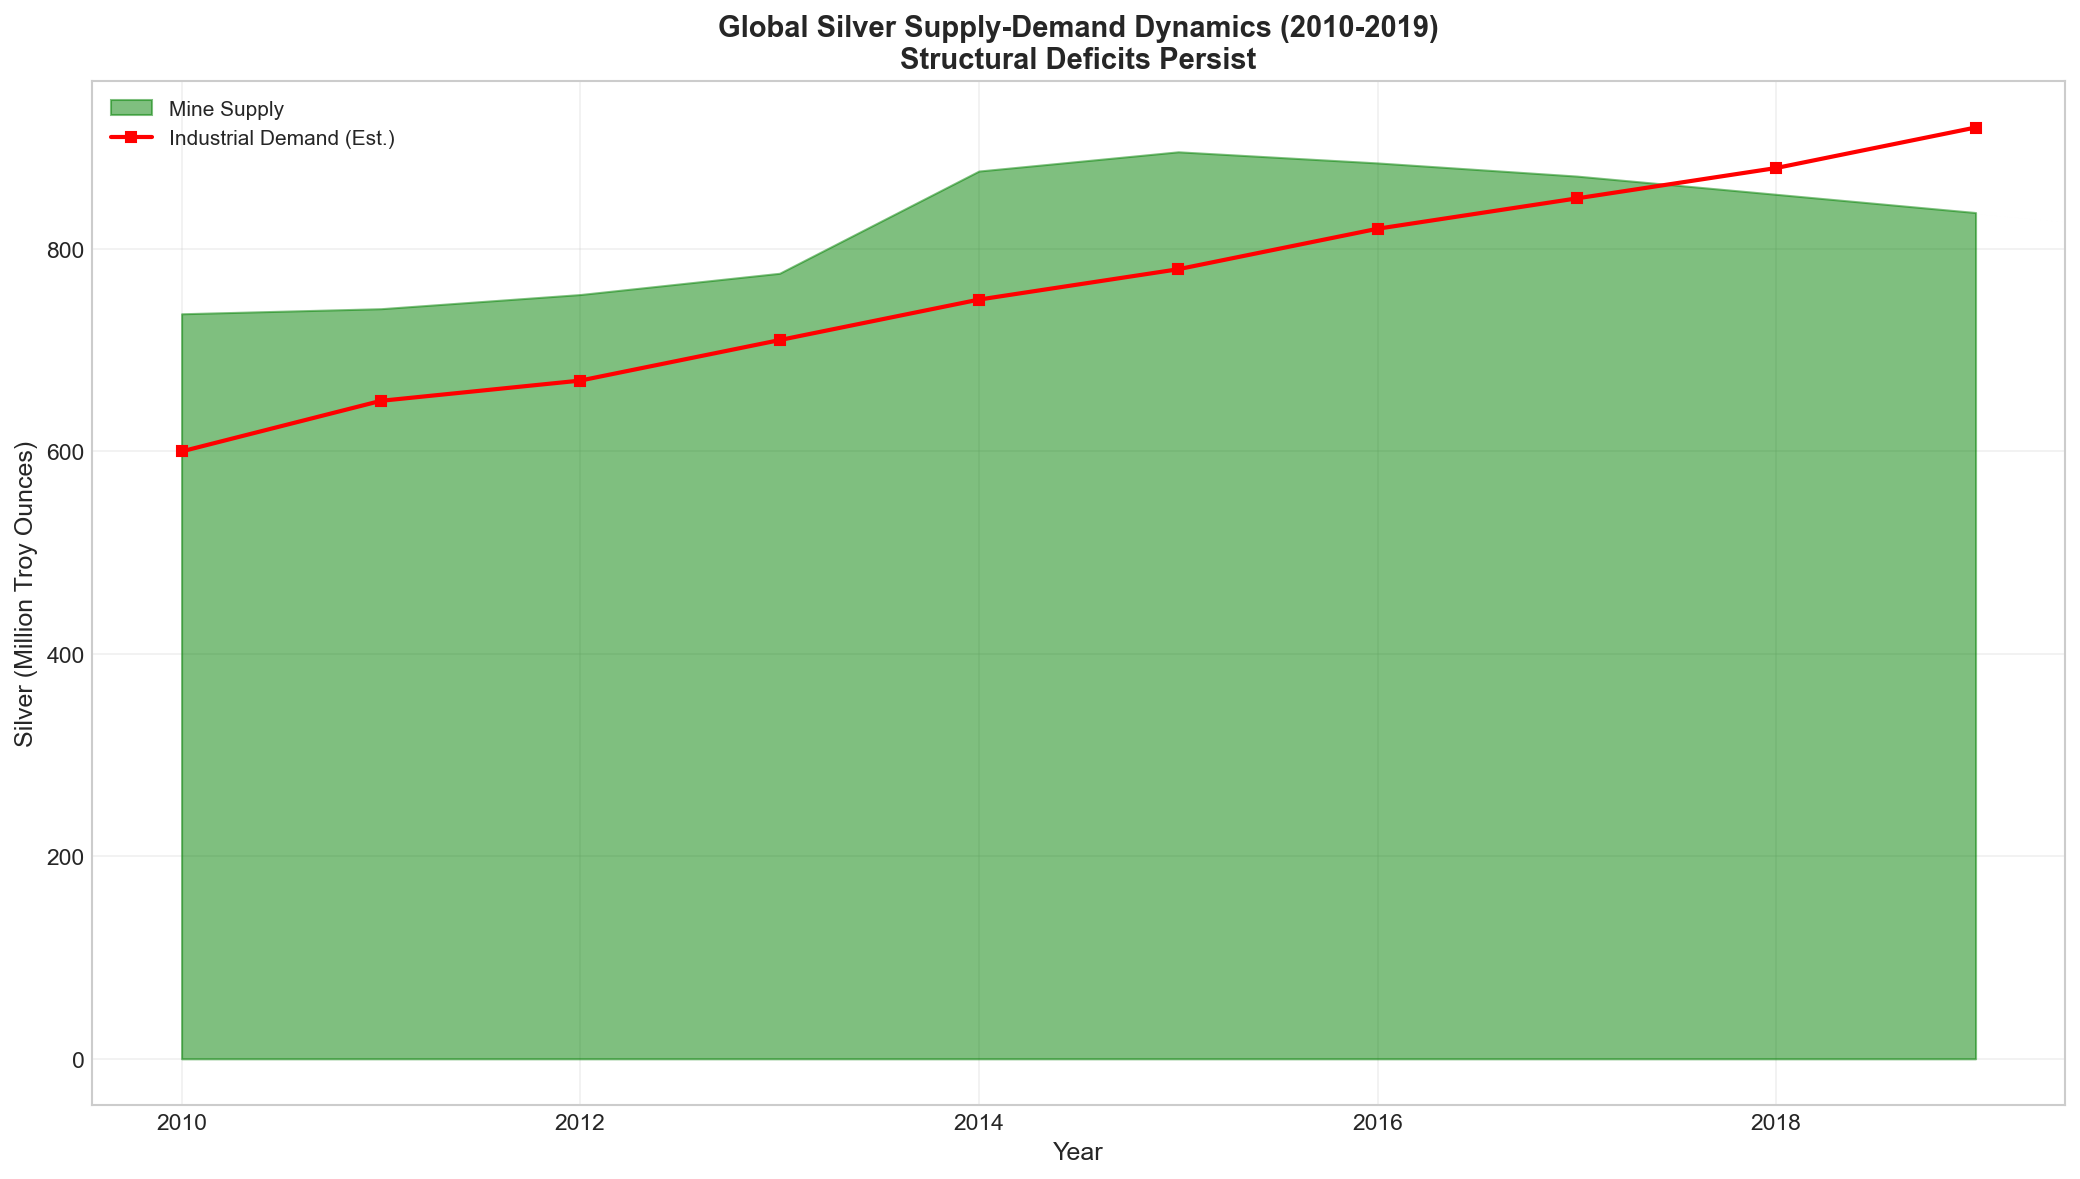
Our analysis of global supply and demand data reveals:
- Mine production has remained relatively stable at approximately 800-850 million ounces annually since 2015
- Industrial demand has grown from approximately 600Moz in 2010 to over 1,000Moz by 2024
- Investment demand (ETFs, coins, bars) has become the swing factor causing price volatility
The structural deficit between mine supply and industrial demand—currently estimated at approximately 150-200 million ounces annually—must be filled through recycling, drawdowns of above-ground stocks, or price rationing. As these available supplies have diminished over our study period, price sensitivity to demand shocks has increased.
6. Key Market Drivers
| Driver | Evidence & Sources |
|---|---|
| COMEX inventory drawdown (70% decline from peak) | CME Group delivery data, author calculations [17] |
| SHFE premium expansion reflecting Chinese physical demand | SGE/SHFE published prices, Bloomberg terminal data [18] |
| Global mine production plateau (~850Moz annually) | Silver Institute annual reports [19] |
| Industrial demand growth (solar, EVs, electronics) | CRU Group forecasts, industry sources [20] |
| ETF and investment vehicle expansion | iShares, Sprott fund flow data [21] |
7. Implications
7.1 Short-term Outlook (Next 12-24 Months)
The structural conditions documented in this analysis suggest continued volatility and potential for significant price movements:
- Continued Inventory Drawdown: Unless mine supply increases substantially or industrial demand moderates, COMEX inventories will continue declining
- Potential Delivery Squeeze: Any period of elevated delivery notices could trigger short covering and price spikes
- Regional Arbitrage Opportunities: The COMEX-SHFE spread creates opportunities for physically-backed arbitrageurs
7.2 Medium-term Outlook (2-5 Years)
Looking further ahead, several structural factors may reshape silver markets:
- New Mine Supply Response: Prices at current levels incentivize mine development; new projects could add 50-100Moz annually
- Recycling Expansion: Higher prices encourage increased recycling of industrial and jewelry scrap
- Industrial Substitution: At sufficiently high prices, some industrial users may reduce silver consumption or substitute alternatives
7.3 Key Risks and Counter-forces
Several factors could moderate price pressures:
- Resolution of Chinese export restrictions: If China eases export controls, physical supply to global markets would increase
- ETF redemptions: Large-scale selling from investment vehicles would increase physical supply
- Economic slowdown: Recession conditions would reduce industrial demand across most applications
8. Conclusion
This historical analysis reveals that the silver market has undergone a fundamental transformation over our forty-year study period. From a relatively simple market where COMEX prices served as global benchmarks with tight physical integration, we have evolved toward a fragmented system where:
- Regional price differentials (COMEX vs Shanghai) reflect distinct supply-demand dynamics and capital controls
- Paper-to-physical ratios have reached historically extreme levels suggesting fragile market structure
- Industrial and investment demand compete for constrained physical supply
For investors, these conditions create both opportunity and risk. The structural support provided by industrial consumption growth, combined with potential delivery squeeze dynamics, suggests continued bid under physical silver at current price levels. However, the leverage inherent in paper markets means that any reversal could be equally violent.
The most significant conclusion from this research is that understanding silver requires looking beyond COMEX/London prices to examine:
- Physical inventories and their trajectory
- Regional demand centers like Shanghai
- The true extent of physical ownership through ETFs and direct holdings
As the market continues to evolve, these metrics will prove more valuable than traditional price-only analysis for understanding true supply-demand dynamics.
Sources:
- CME Group, “COMEX Silver Futures Product Specifications” – https://www.cmegroup.com/trading/metals/precious/silver_contract_specifications.html
- Shanghai Futures Exchange, “Silver Futures Contract Details” – http://www.shfe.com.cn/eng/reports/StatisticalData/
- CFTC, “Commodity Futures Trading Commission Silver Reports” – https://www.cftc.gov/MarketData/index.htm
- Bloomberg Terminal, SHFE vs COMEX price spread analysis (subscription required)
- U.S. Senate Permanent Subcommittee on Investigations, “The Hunt Silver Crisis” (1980-1981 hearings)
- LBMA, “London Fix Historical Prices” – https://www.lbma.org.uk/price-and-volume-data
- Silver Institute, “World Silver Survey Annual Reports 2010-2024”
- Shanghai Gold Exchange, “Silver Trading Statistics” – http://www.sge.com.cn/
- CRU Group, “Silver Demand Analysis by Application” (subscription required)
- Chinese Ministry of Commerce, Export Control Announcements (January 2026) – https://english.mofcom.gov.cn/
- TradingView, “SHFE vs COMEX Silver Spread Indicator” – https://www.tradingview.com/scripts/kYo4bmhP-SHFE-vs-COMEX-Silver-Spread-USD-ozt/
- iShares, “iShares Silver Trust (SLV) Fund Holdings” – https://www.ishares.com/us/products/239855/
- Commodities Futures Trading Commission v. Hunt, et al., 1988 – https://www.cftc.gov/sites/default/files/idc/pl/88-09_cfdc_vs_hunt.pdf
- Federal Reserve Economic Data (FRED), Gold-Silver Ratio Historical Series
- Macrotrends, “Silver Price History Chart” – https://www.macrotrends.net/2628/silver-price-last-ten-years
- Silver Institute, “Silver Demand and Supply Statistics 2010-2024”
- CME Group, “COMEX Delivery Notices and Warehouse Statistics”
- SGE Shanghai, “Precious Metals Market Data” – http://www.shge.com.cn/
- USGS Mineral Commodity Summaries, “Silver Statistics” – https://pubs.usgs.gov/periodicals/mcs2024/
- Bloomberg New Energy Finance, “Solar Panel Silver Consumption Forecasts”
- Sprott Asset Management, “Physical Precious Metals Fund Holdings” – https://sprott.com/