Copper: The Metal That Makes the Modern World Work
A comprehensive deep dive into copper markets, supply constraints, demand drivers, and why Stanley Druckenmiller calls it the tightest market he's ever studied.
Copper: The Metal That Makes the Modern World Work (And Why Stanley Druckenmiller Is Paying Attention)
Stanley Druckenmiller doesn’t throw around superlatives casually. When he said in 2023 that copper was in “the tightest position I’ve ever studied,” people who manage money for a living took notice. This is a guy who ran Soros’s Quantum Fund, generated 30% annual returns for three decades, and famously bet against the British pound in 1992. He doesn’t make market calls on CNBC for entertainment.
So what’s got him so focused on copper?
Let’s dig into the copper market the same way we’d analyze gold or silver, but recognizing that copper plays by different rules. This isn’t a monetary metal. Central banks don’t stockpile it. You can’t bury it in your backyard and feel secure during a currency crisis. But copper might just be the most important industrial commodity on Earth, and right now, the math behind supply and demand is getting genuinely interesting.
What Copper Actually Does (And Why We Need So Much of It)
Before we talk price, let’s talk utility. Gold serves as money—central banks hold it as a reserve asset, and for thousands of years it has functioned as a store of value and medium of exchange. Yes, it has industrial uses in electronics and jewelry, but its primary role is monetary. Silver sits in between—part industrial, part monetary. But copper? Copper is purely industrial.
About 26% of global copper demand goes into building construction—wiring, plumbing, HVAC systems. Another 23% goes into consumer electronics and general products. Power generation and transmission soak up 17%. Transportation (including the EV revolution) takes 13%. Industrial machinery uses 12%. The rest is scattered across various applications.
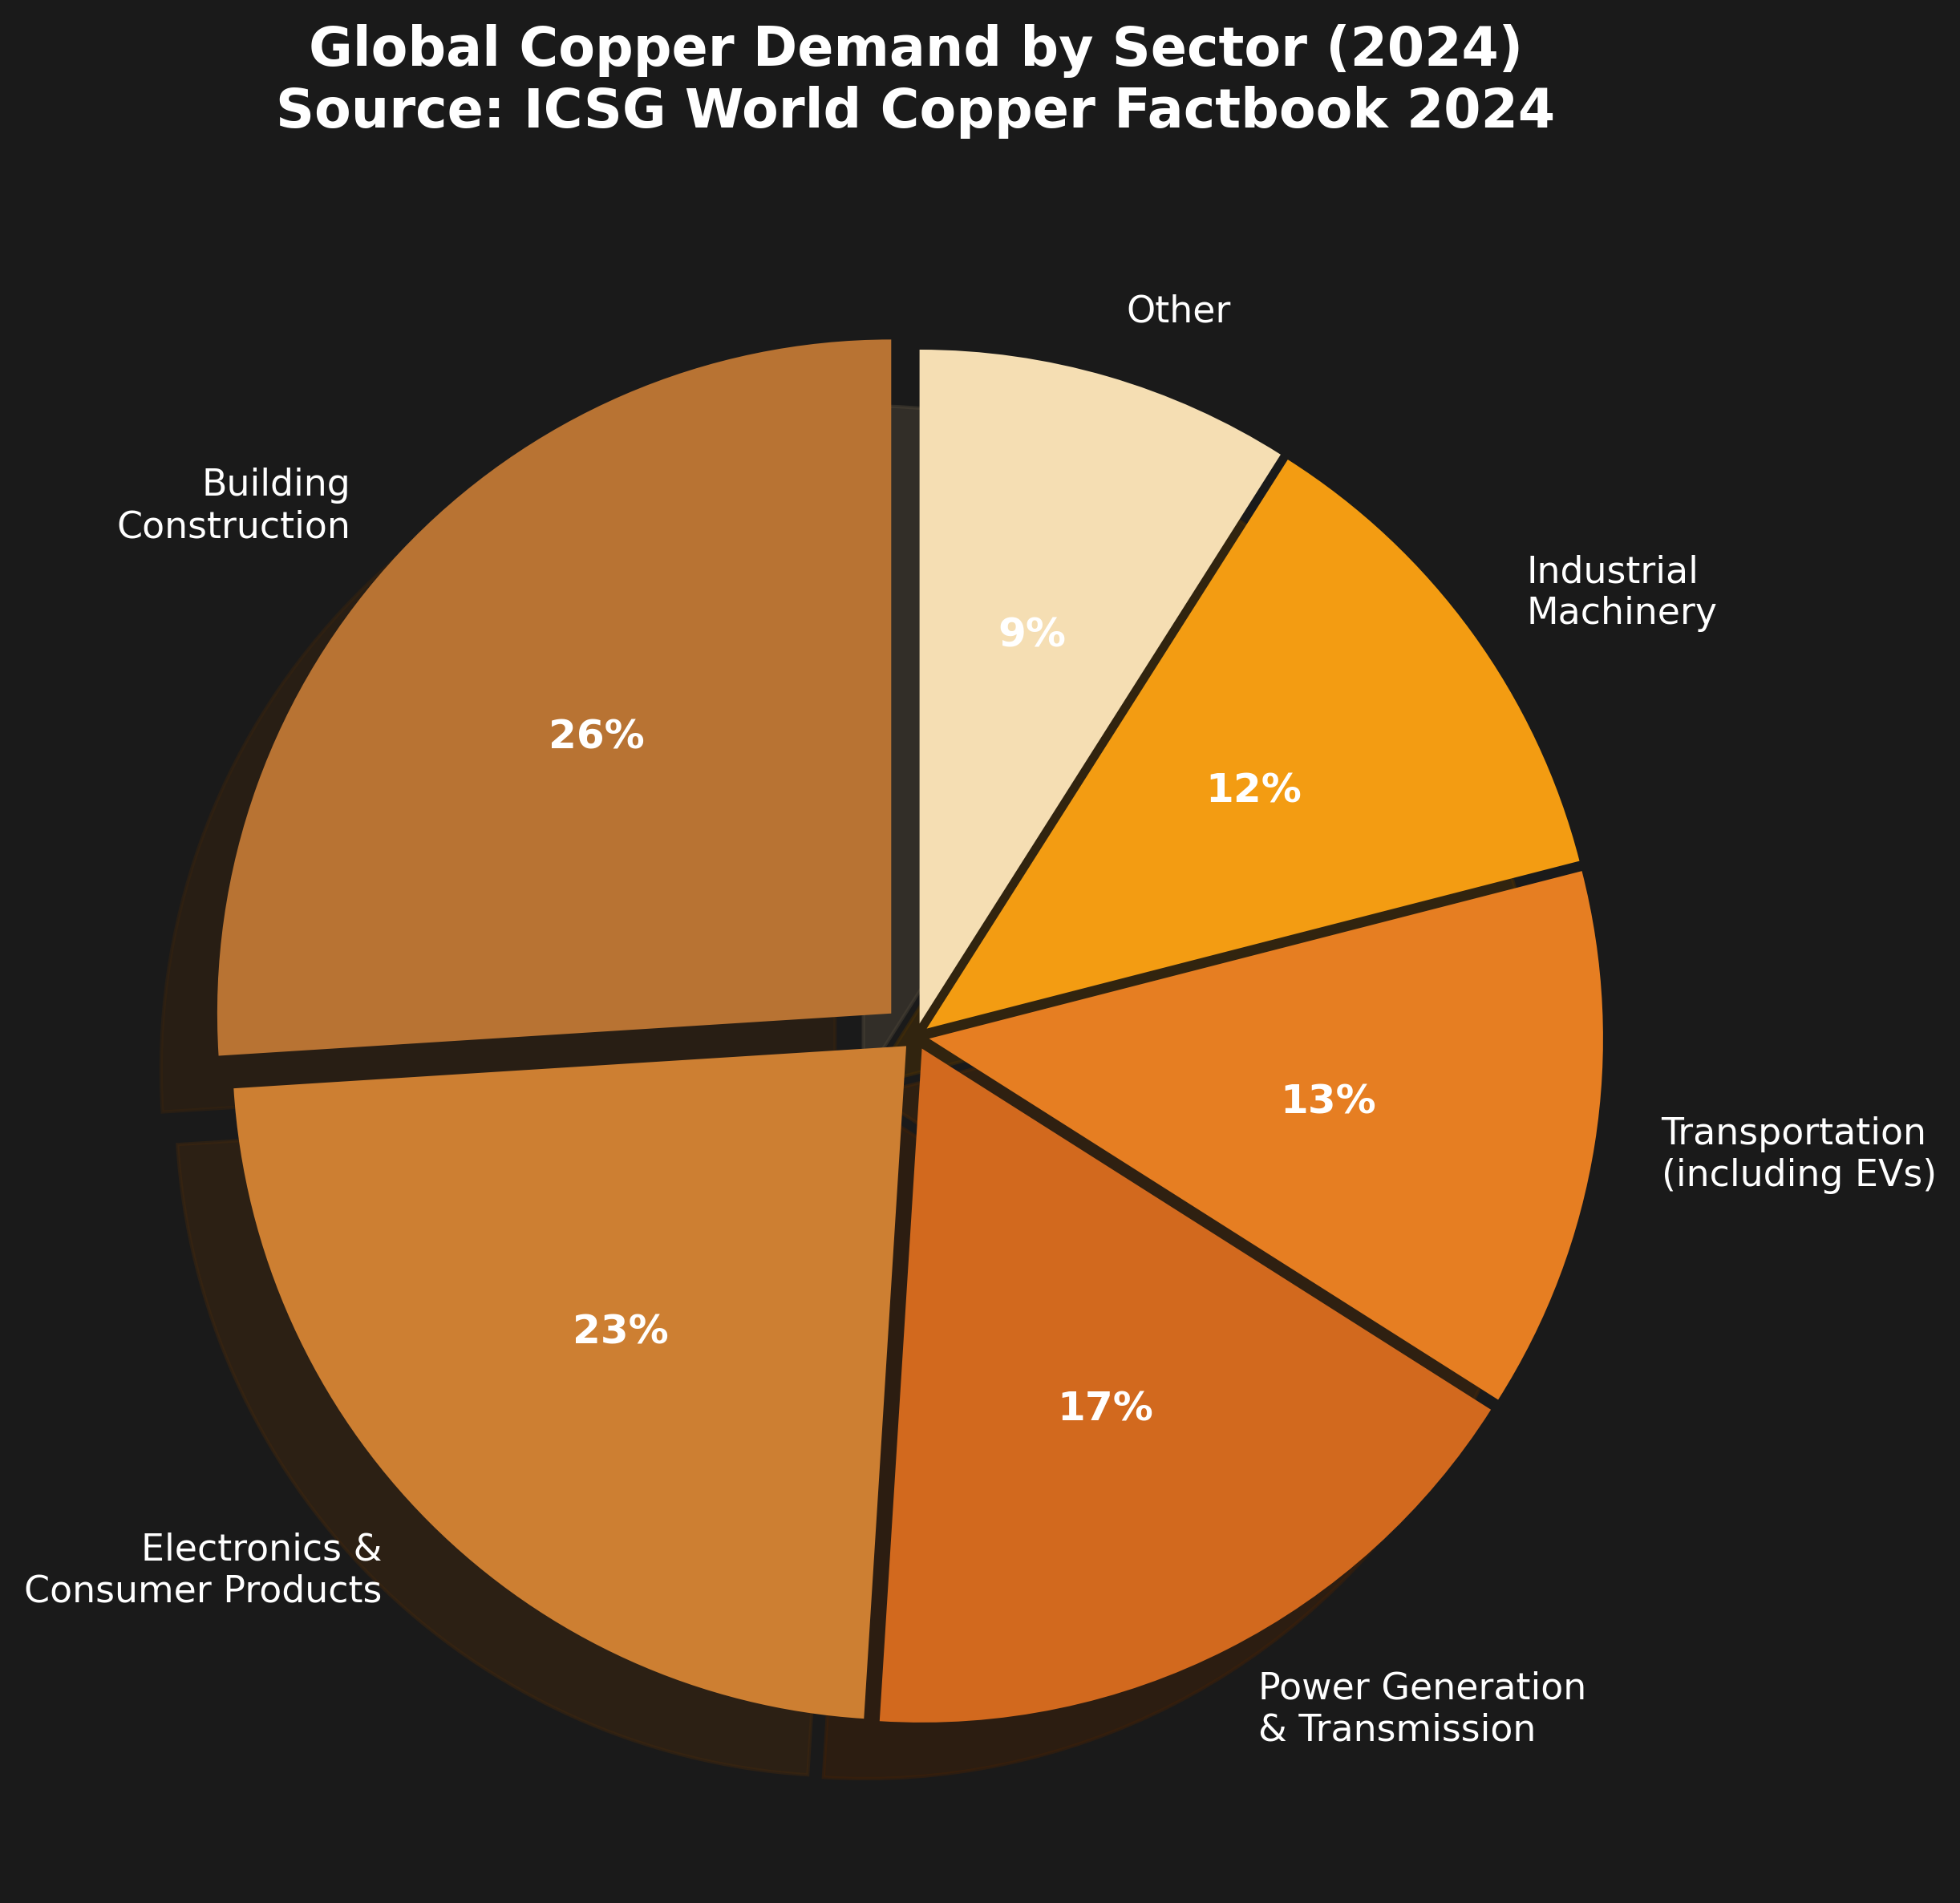 Source: ICSG World Copper Factbook 2024
Here’s the key insight: copper is the metal of electrification. Every electrical wire, every motor, every transformer, every data center, every electric vehicle motor and battery pack—they all need copper. Not want. Need. There is no substitute for copper’s conductivity in most applications. Aluminum can work in some transmission lines, but for anything requiring reliability and efficiency, copper is non-negotiable.
The Energy Transition is a Copper Story
This is where things get interesting from a demand perspective. The world is attempting what might be the largest infrastructure buildout in human history—the transition from fossil fuels to renewable energy and electrified transport. And this transition is incredibly copper-intensive.
An internal combustion engine vehicle uses about 23 kg of copper. A battery electric vehicle? 83 kg. That’s 3.6 times as much. And it’s not just the cars themselves—charging infrastructure, the expanded electrical grid needed to support millions of EVs, solar installations (2.5-5.5 tonnes of copper per MW), wind turbines (2.5-11 tonnes per MW depending on whether they’re onshore or offshore), battery storage systems, data centers for AI—all of it needs copper.
To put numbers on this: The International Energy Agency estimates that meeting net-zero targets by 2050 will require roughly doubling copper demand from 2020 levels. That’s an additional 12-13 million tonnes per year by 2035 just for energy transition applications.
Compare this to gold, where investment demand can swing wildly based on sentiment, inflation fears, and real yields. Copper demand from the energy transition is structural, policy-backed, and relatively price-inelastic. If governments are serious about their green commitments, they need the copper regardless of price.
Who’s Actually Buying All This Copper?
China matters here even more than it does for gold. China accounts for roughly 52-57% of global refined copper consumption. The country consumes more copper than the next ten largest consumers combined. When China sneezes, the copper market catches pneumonia.
In 2024, China consumed approximately 14.6 million tonnes of refined copper. To put that in perspective, global mine production is only about 23 million tonnes. China alone uses nearly two-thirds of all the copper mined in the world.
But China’s demand story has gotten complicated. The country is dealing with a historic property sector crisis—Evergrande’s $300 billion collapse, Country Garden’s $200 billion implosion, housing starts down 25% year-over-year. Real estate construction has been a massive copper consumer, so this should be terrible for demand, right?
Here’s the twist: Chinese copper demand has remained remarkably resilient. Manufacturing and infrastructure investment are up. The country is building renewable energy capacity at a breakneck pace—solar and wind installations that require enormous amounts of copper. And China has become the world’s factory for electric vehicles, exporting EVs globally.
The property sector weakness is real, but it’s being offset by the manufacturing and green energy buildout. China’s copper demand was roughly flat in 2024 (declining 0.1% according to IWCC forecasts) despite the property crisis. However, longer-term projections show copper demand growing at a 2.6% CAGR through 2034. The composition of demand is shifting—from buildings to batteries, from apartments to automobiles.
The rest of Asia accounts for another chunk of demand—India, Japan, South Korea, Southeast Asia. Europe takes about 15% of global consumption. The Americas (North and South) account for roughly 10%.
Long-term projections suggest China will see slower growth as its infrastructure needs mature. But the U.S., India, and Southeast Asia are expected to pick up the slack. India’s copper demand is forecast to grow 30% by 2031. U.S. demand could increase 50% over the same period as grid modernization and onshoring accelerate.
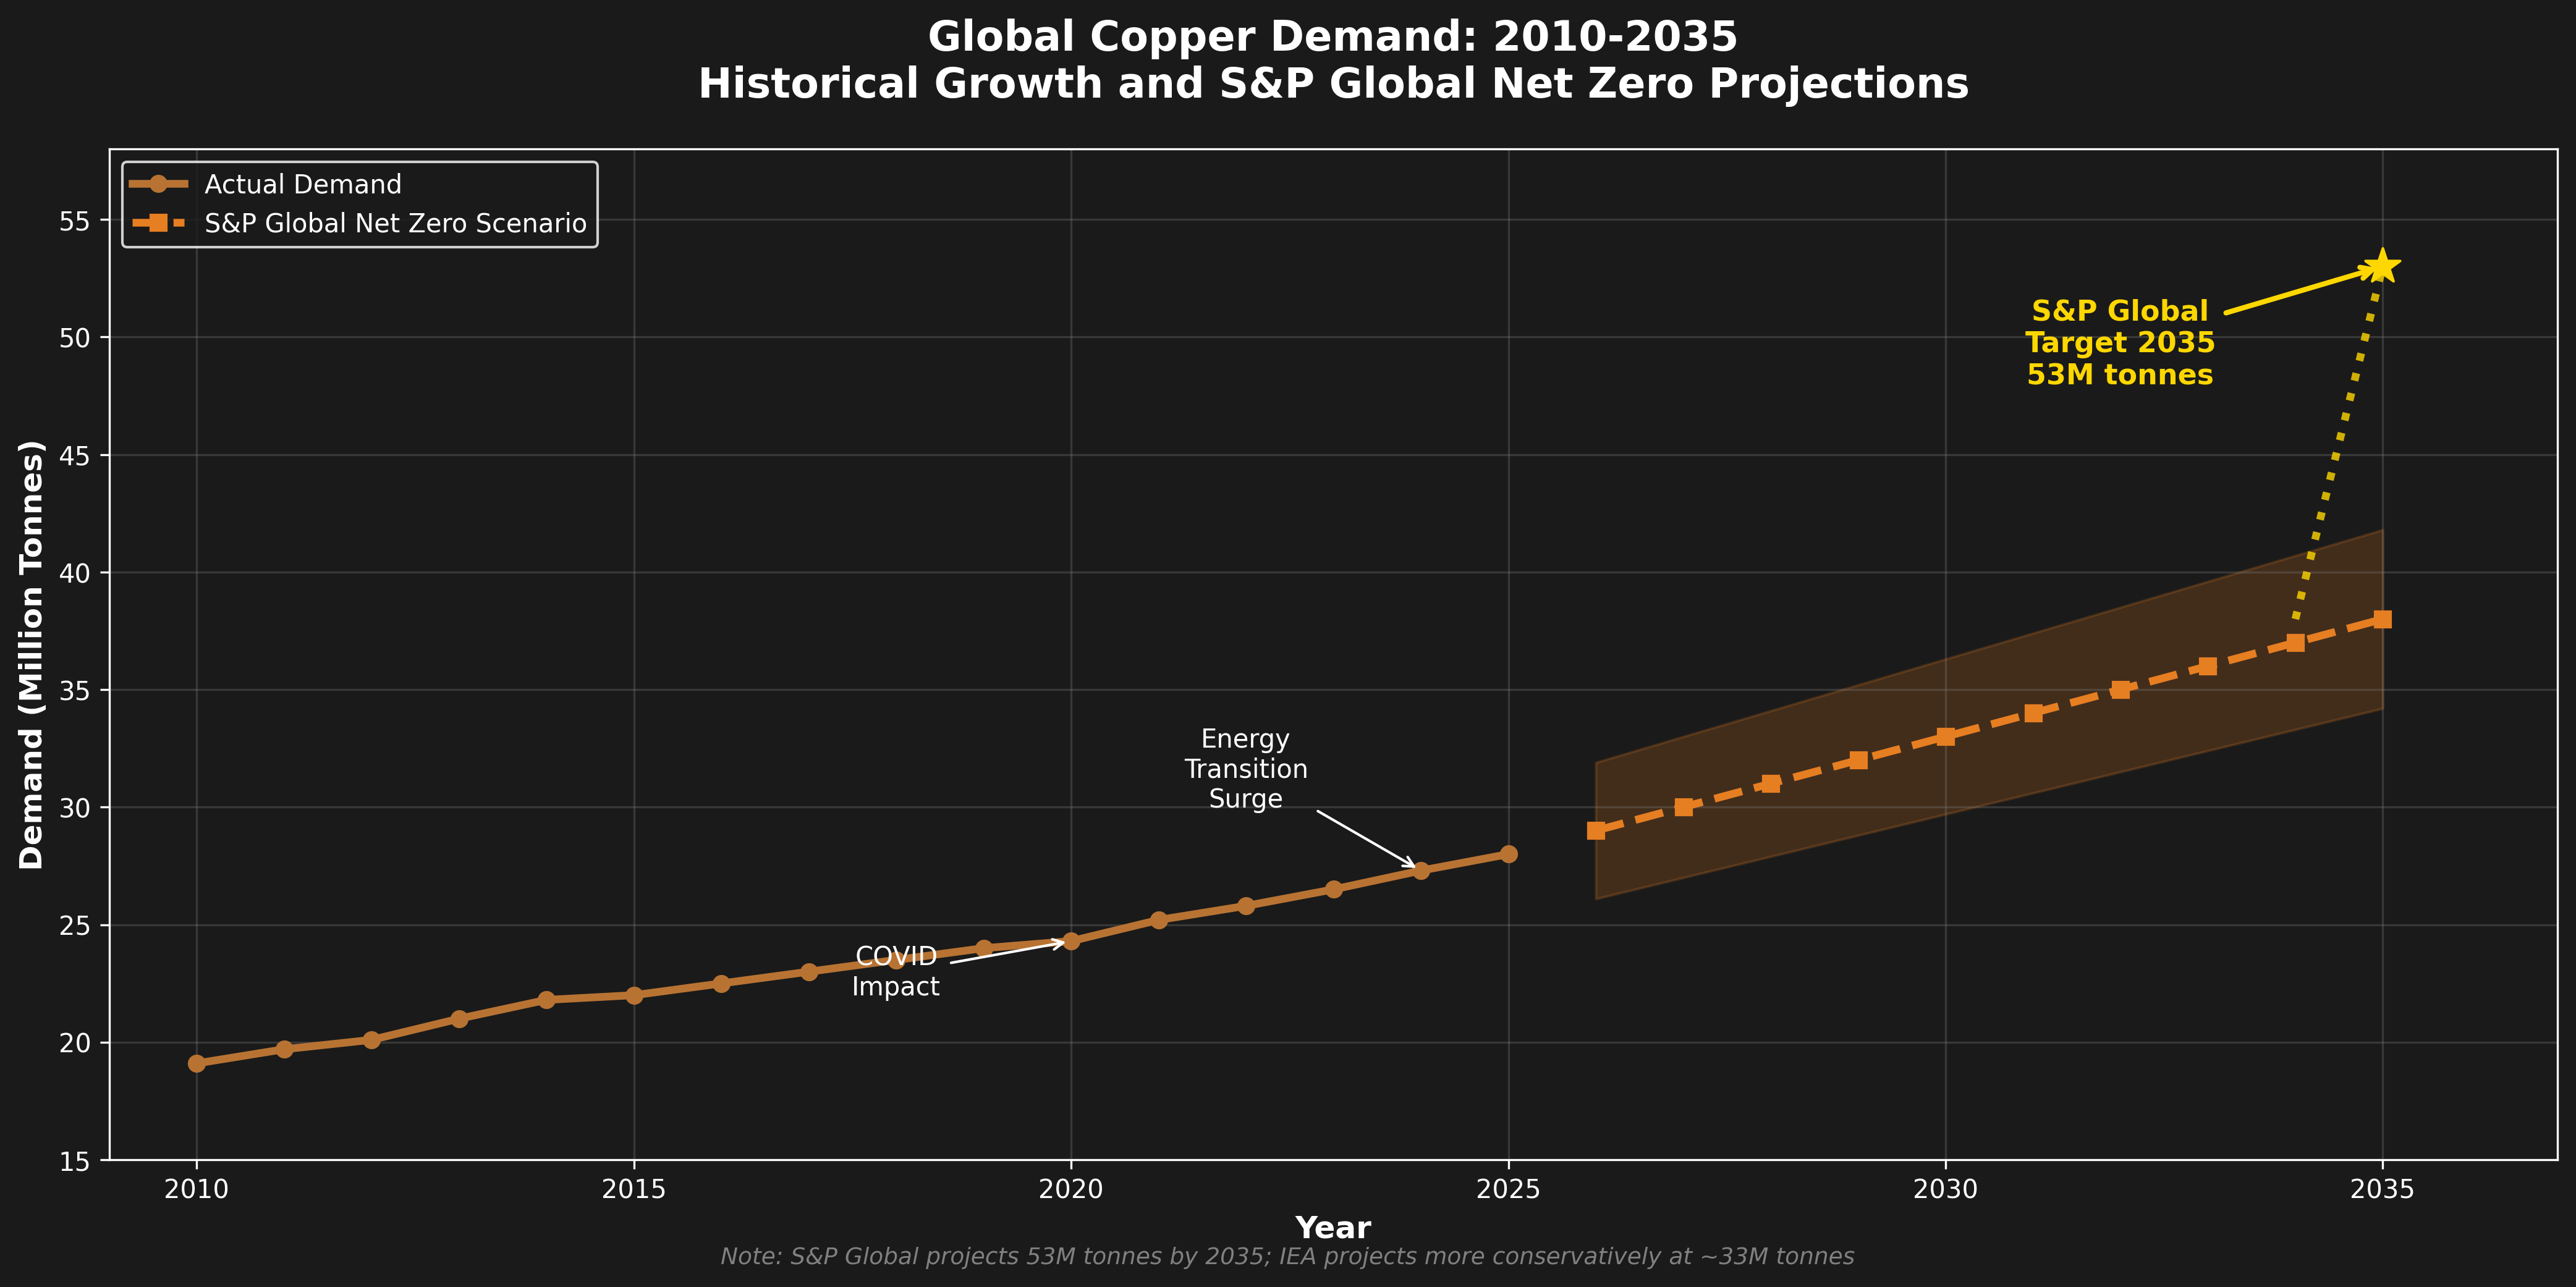 Historical demand growth (solid line) vs S&P Global Net Zero projections (dashed line). The 2035 target of 53 million tonnes represents nearly a doubling from 2020 levels. Note: IEA projects more conservatively at ~33M tonnes by 2035.
The Supply Side: Where the Problems Start
Now we get to why Druckenmiller is interested. The supply side of copper is where things get genuinely problematic.
The Grade Problem
In 1999, the average copper ore grade was around 1.5%. Today it’s roughly 0.6% and falling. This is a massive deal that most investors don’t fully appreciate. It means miners must process three times as much rock to produce the same amount of copper. More equipment, more energy, more water, more labor, more time—all for the same output.
Chile, the world’s largest copper producer (23% of global supply), has seen ore grades drop 30% over the past 15 years. The result: despite massive investment, Chilean production has stagnated around 5.3 million tonnes annually, well below the 6 million tonnes the country was targeting.
This isn’t a temporary problem. Ore bodies are finite. The easy, high-grade deposits were found and mined decades ago. What’s left requires moving mountains—literally—of lower-grade material.
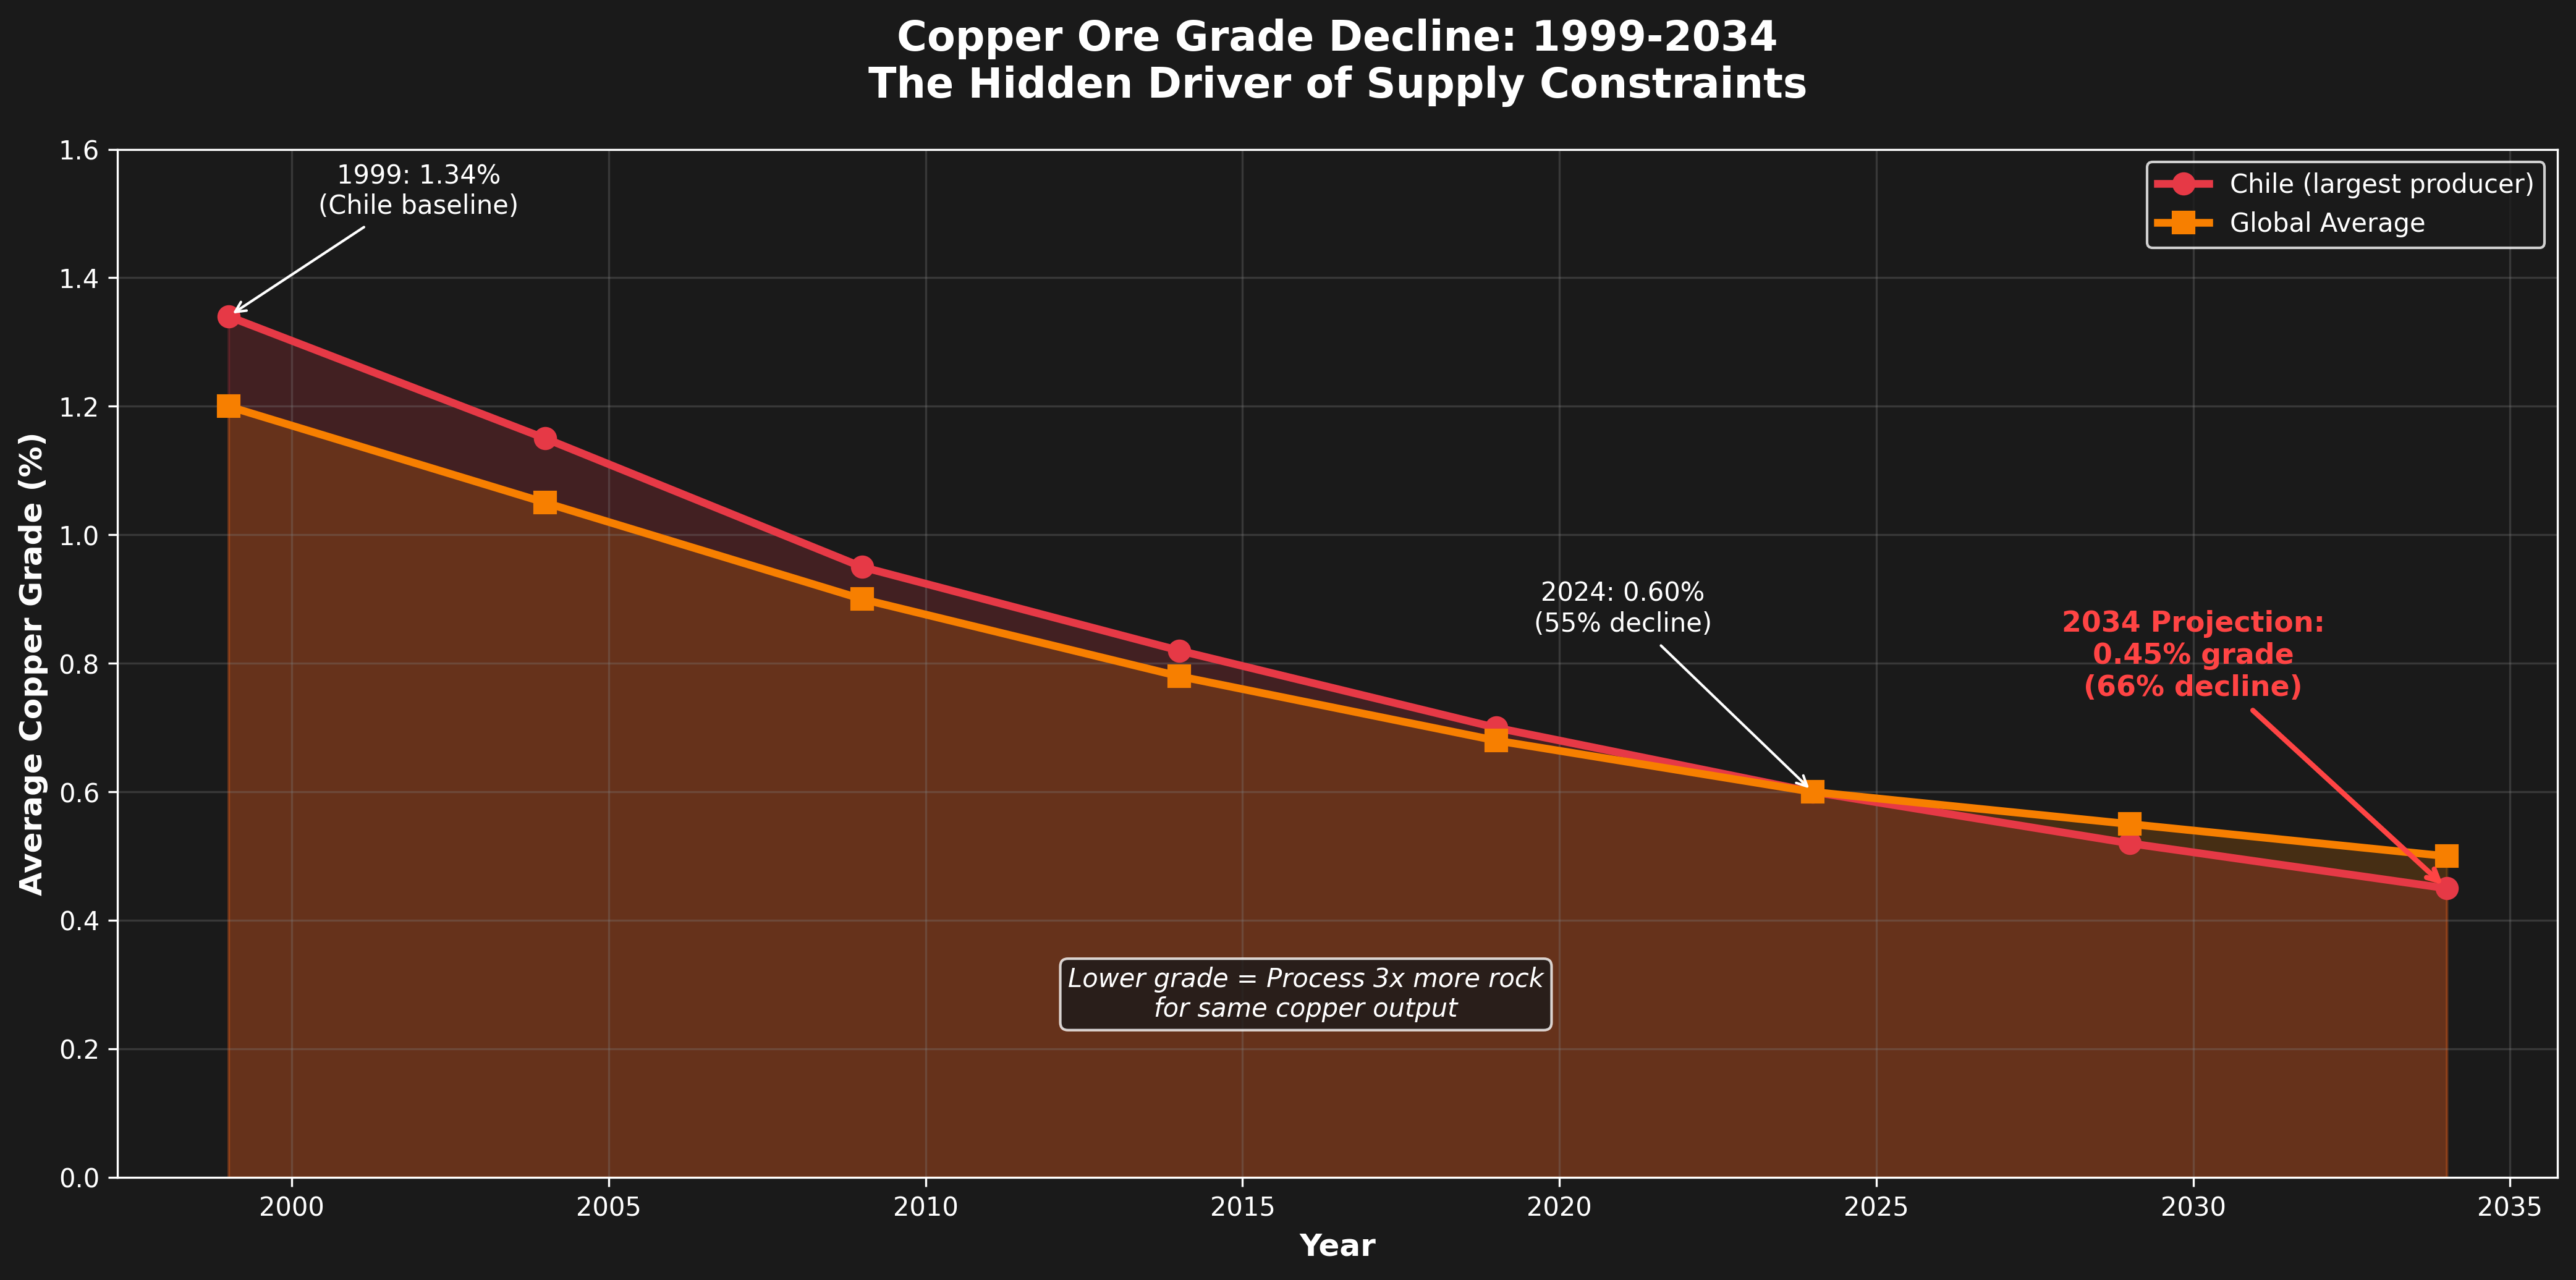 Chilean ore grades have dropped from 1.34% (1999) to 0.60% (2024)—a 55% decline. At these grades, miners must process 3x more rock for the same copper output.
The Water Problem
Copper mining is thirsty work. Chile’s Atacama Desert, home to some of the world’s largest copper mines, is experiencing a 15-year megadrought. Mines that used to rely on groundwater are now spending billions on desalination plants and pipelines to pump water hundreds of kilometers uphill.
About 50% of global copper production occurs in areas facing high water stress. This is a structural constraint that isn’t going away. Either miners pay more for water infrastructure, or they produce less copper.
The Political Problem
Here’s a statistic that should concern any copper bull: 42% of world copper production comes from countries facing significant political uncertainty. Chile and Peru (together about 34% of global supply) have seen left-wing governments propose windfall taxes that could take 70% or more of mining profits when copper prices are high. The Democratic Republic of Congo (14% of supply and growing fast) has a history of resource nationalism and sudden tax changes.
Chile’s constitutional reform process has miners nervous. Peru’s government has shut down major mines due to community protests—Las Bambas, one of the world’s largest copper mines, has faced interruptions on over 400 days since 2016 due to road blockades and social unrest.
Unlike gold, which can be mined in stable jurisdictions like Nevada, Ontario, or Western Australia, the world’s major copper deposits are disproportionately located in politically challenging regions.
The Discovery Problem
Here’s a sobering fact: Only 14 major copper deposits have been discovered in the past decade, compared to 225 in the previous 23 years. And the timeline from discovery to production has stretched to an average of 17 years globally, and 24-29 years in the United States specifically.
Even if copper prices spike to $15,000 or $20,000 per tonne tomorrow, we won’t see significant new supply before the mid-2030s. The projects that will produce copper in 2030 are already in development today. The pipeline is what it is.
Recent Supply Disruptions (2025)
The market got a harsh reminder of copper’s supply fragility in 2025:
-
Grasberg (Indonesia): A mudslide and flooding in September 2025 forced a 35% production cut. This single event removed 591,000 tonnes of expected supply through 2026. For perspective, that’s more than the entire annual production of most countries.
-
El Teniente (Chile): A tunnel collapse and seismic event at Codelco’s massive underground mine caused the loss of approximately 33,000-48,000 tonnes of production.
-
Kamoa-Kakula (DRC): Seismic activity and flooding forced production cuts of 28% at one of the world’s newest major mines.
Combined with other disruptions, 2025 is shaping up to have the largest copper deficit since 2004—approximately 400,000 tonnes. And 2026 is now projected to see a deficit as well, despite earlier forecasts of a small surplus.
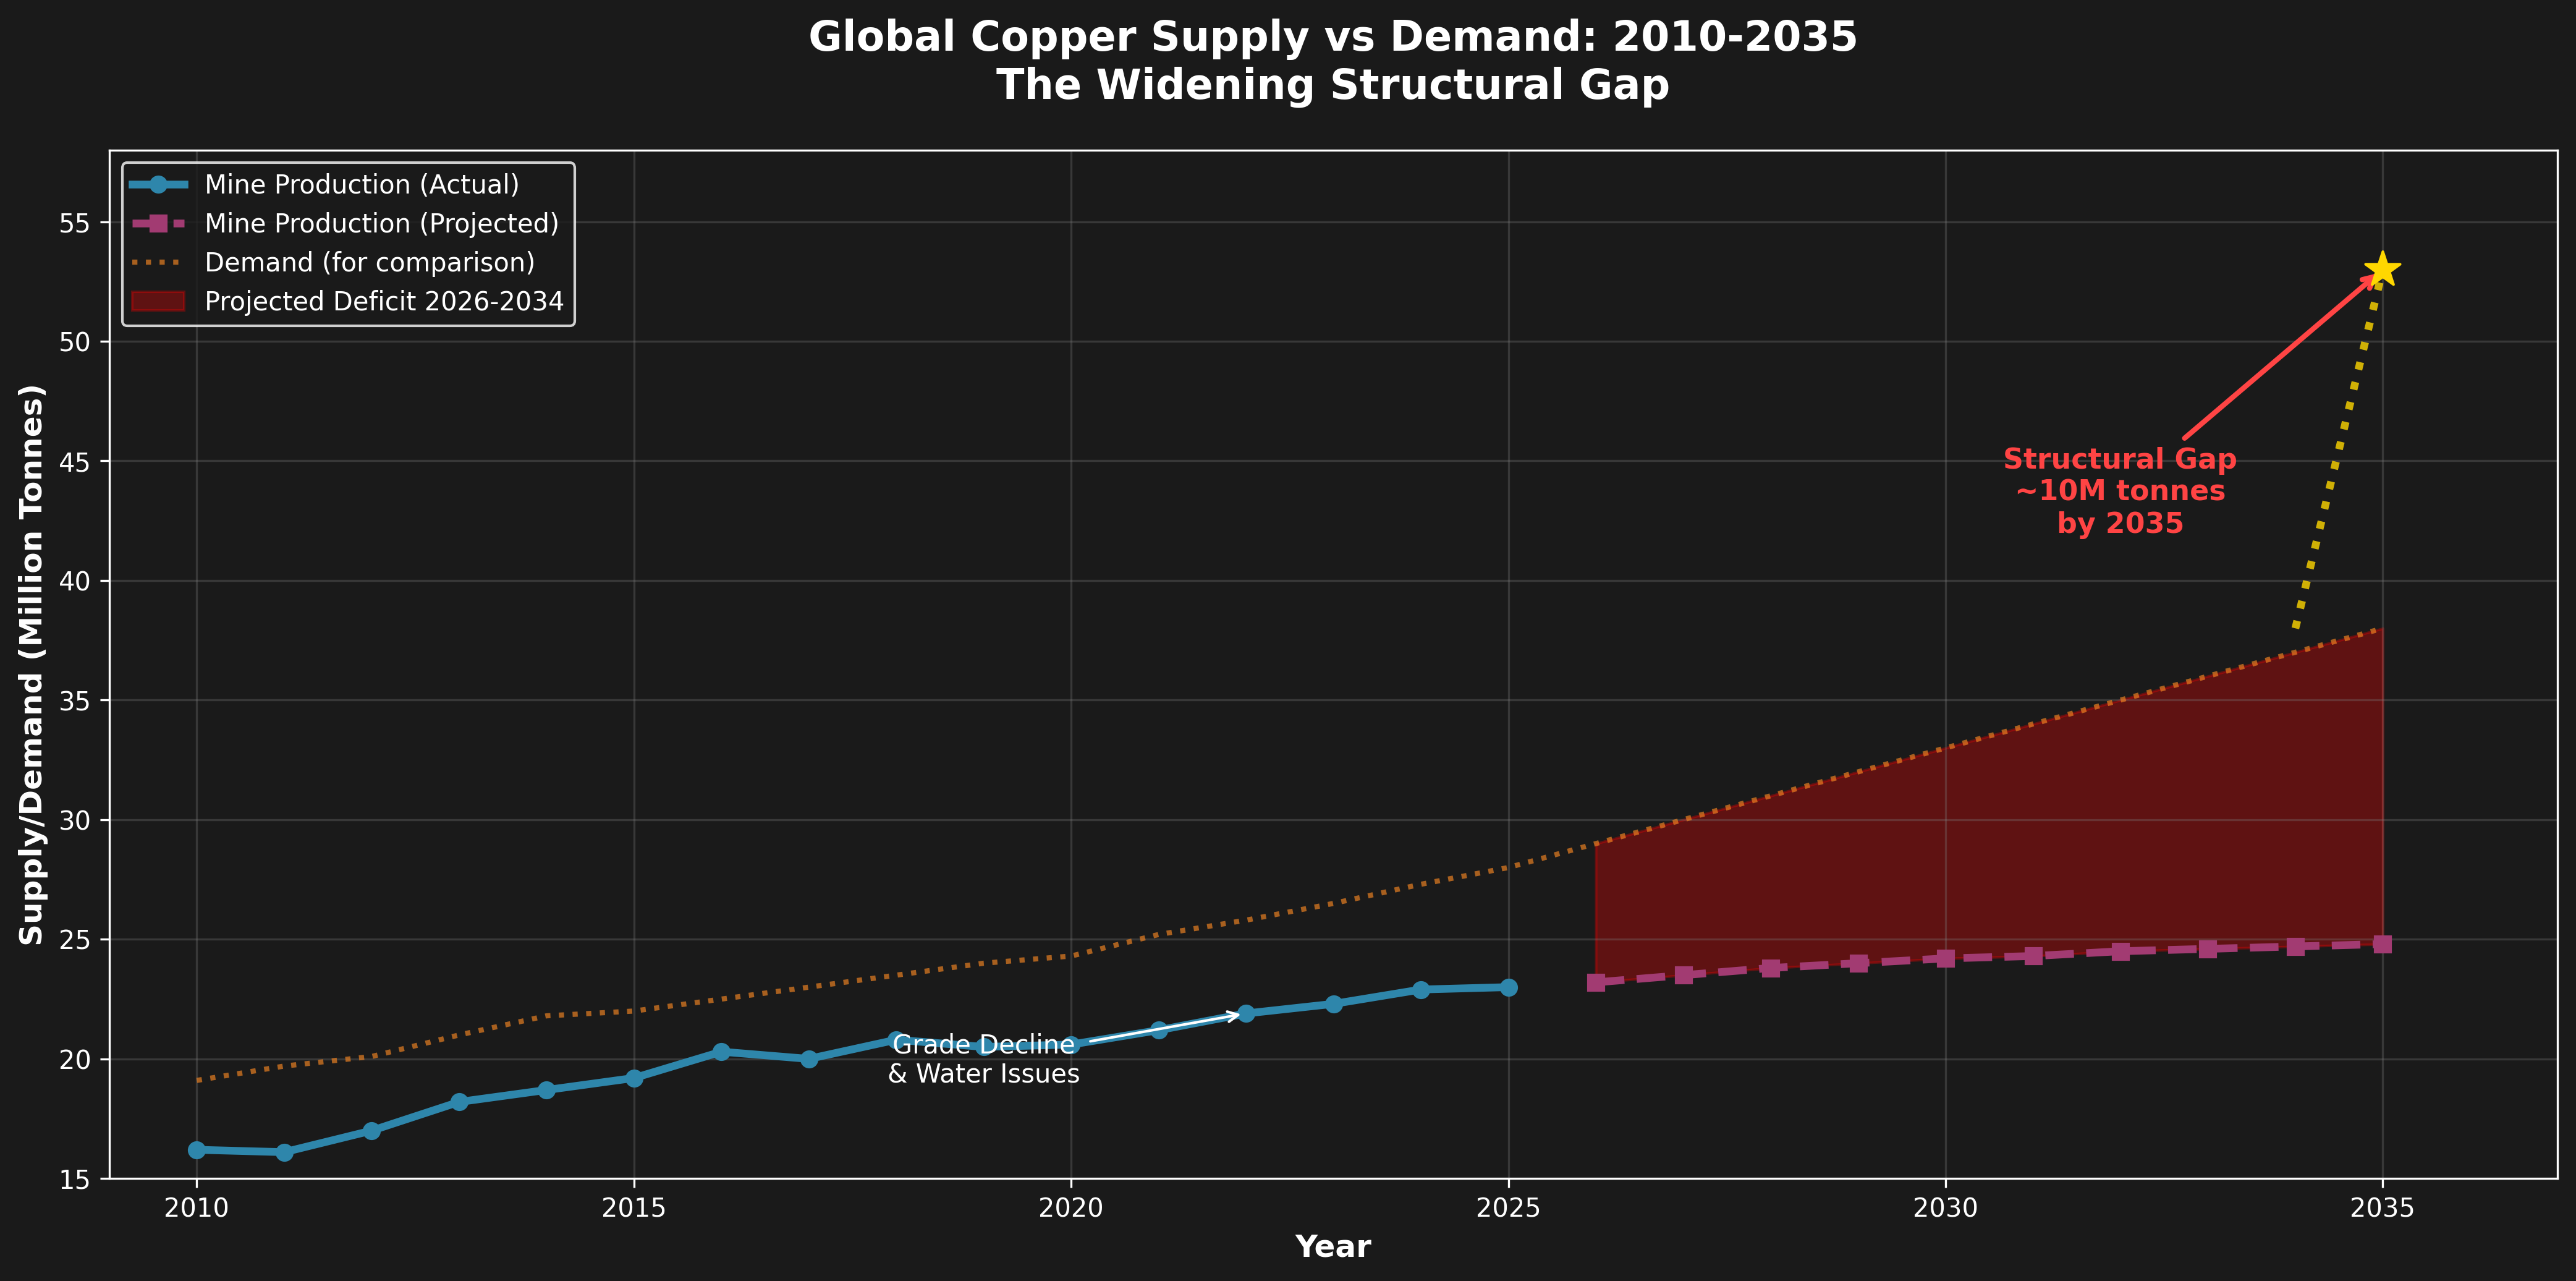 Mine production (blue) vs demand (orange). The red shaded area shows the projected structural deficit widening through 2034. By 2035, the gap could reach ~10 million tonnes (25% shortfall). Source: S&P Global, IEA projections
Inventory: The “Tightest I’ve Ever Seen” Explained
This is where we get to the heart of Druckenmiller’s comment. When he says copper is tight, he’s looking at inventory data. And the inventory picture is genuinely extreme.
Exchange Stocks Are Critically Low
The London Metal Exchange (LME) is the world’s primary copper warehouse system. As of early 2026, LME-registered copper stocks have fallen to historic lows. With global consumption running at approximately 74,000 tonnes per day, current exchange stocks cover roughly 2-4 days of global demand. The historical average is 10-14 days. This is near crisis levels.
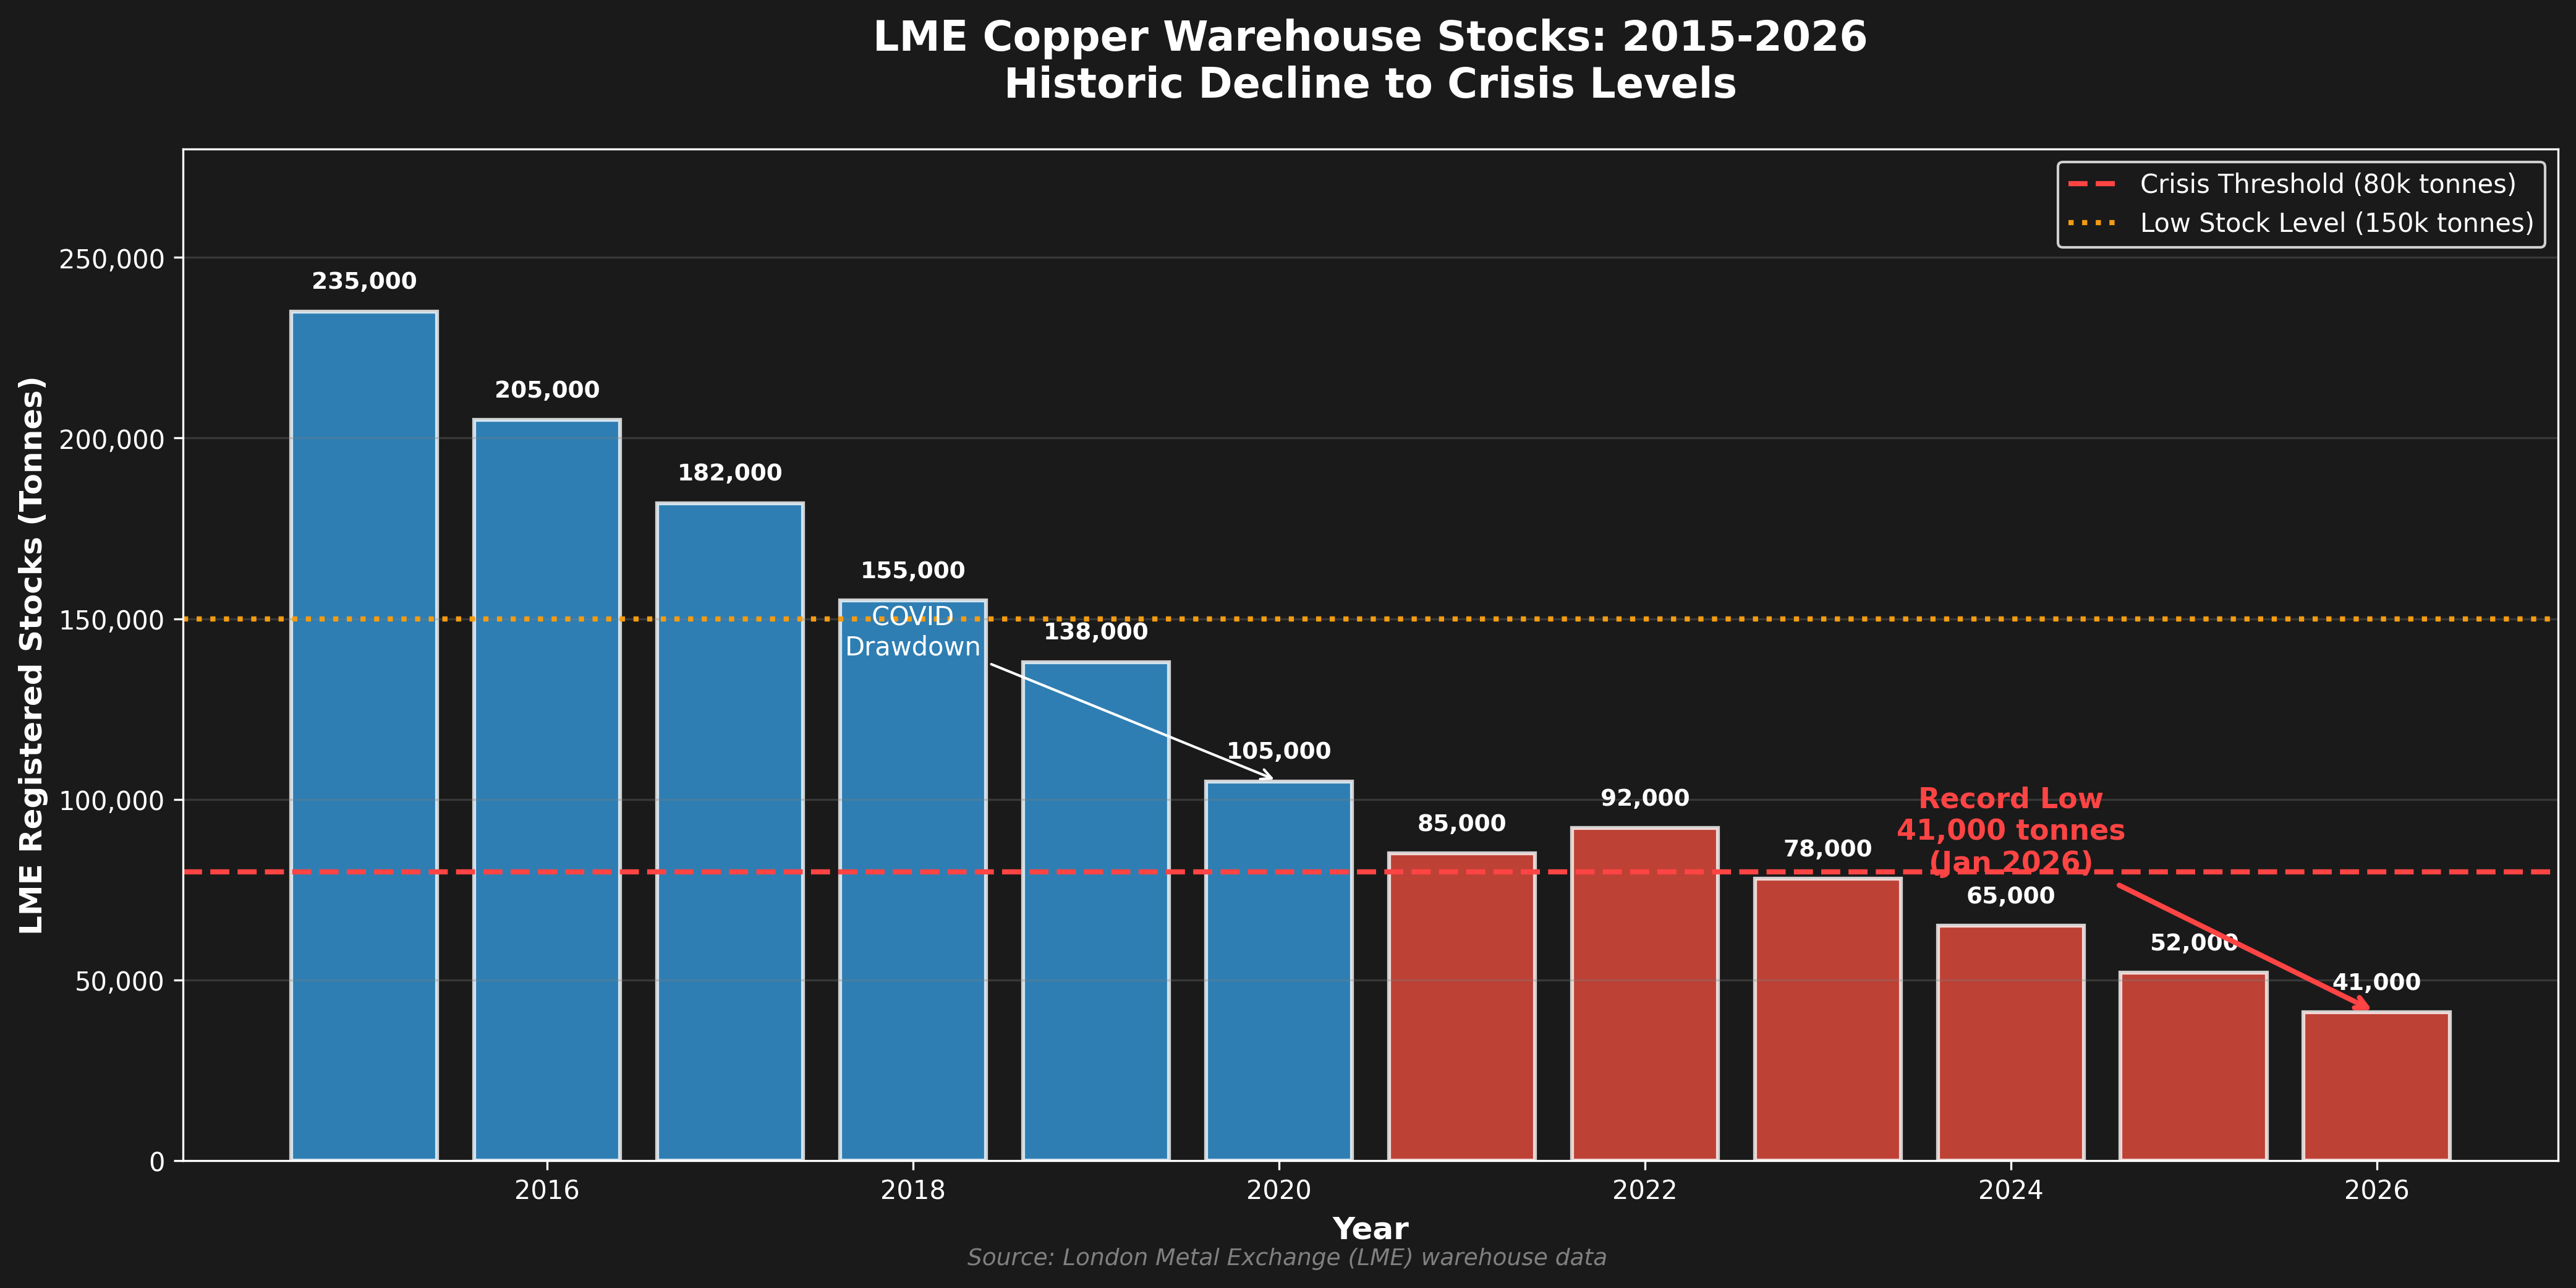 LME registered copper stocks have declined from 235,000 tonnes (2015) to just 41,000 tonnes (Jan 2026)—an 82% drop. Red bars indicate crisis levels below 80,000 tonnes.
COMEX (the U.S. futures exchange) has seen stocks balloon to over 450,000 tonnes—the highest in seven years. But here’s the crucial detail: 95% of LME stocks are Chinese or Russian copper, which cannot be delivered against COMEX futures contracts due to sanctions and quality specifications. So the Western world—the U.S. and Europe—effectively has no inventory buffer.
The Shanghai Futures Exchange (SHFE) has also seen stocks decline to multi-year lows. When you look at exchange-registered copper available to Western consumers, the picture is genuinely alarming.
Days of Consumption Coverage
This is the metric that matters. Global copper consumption runs at roughly 27 million tonnes per year, or about 74,000 tonnes per day. Visible exchange stocks worldwide total less than 800,000 tonnes—about 10 days of global demand.
Compare this to the 1970s or 1980s, when exchange stocks routinely covered 20-30 days of consumption. The just-in-time supply chain has come to copper, and there’s no cushion left.
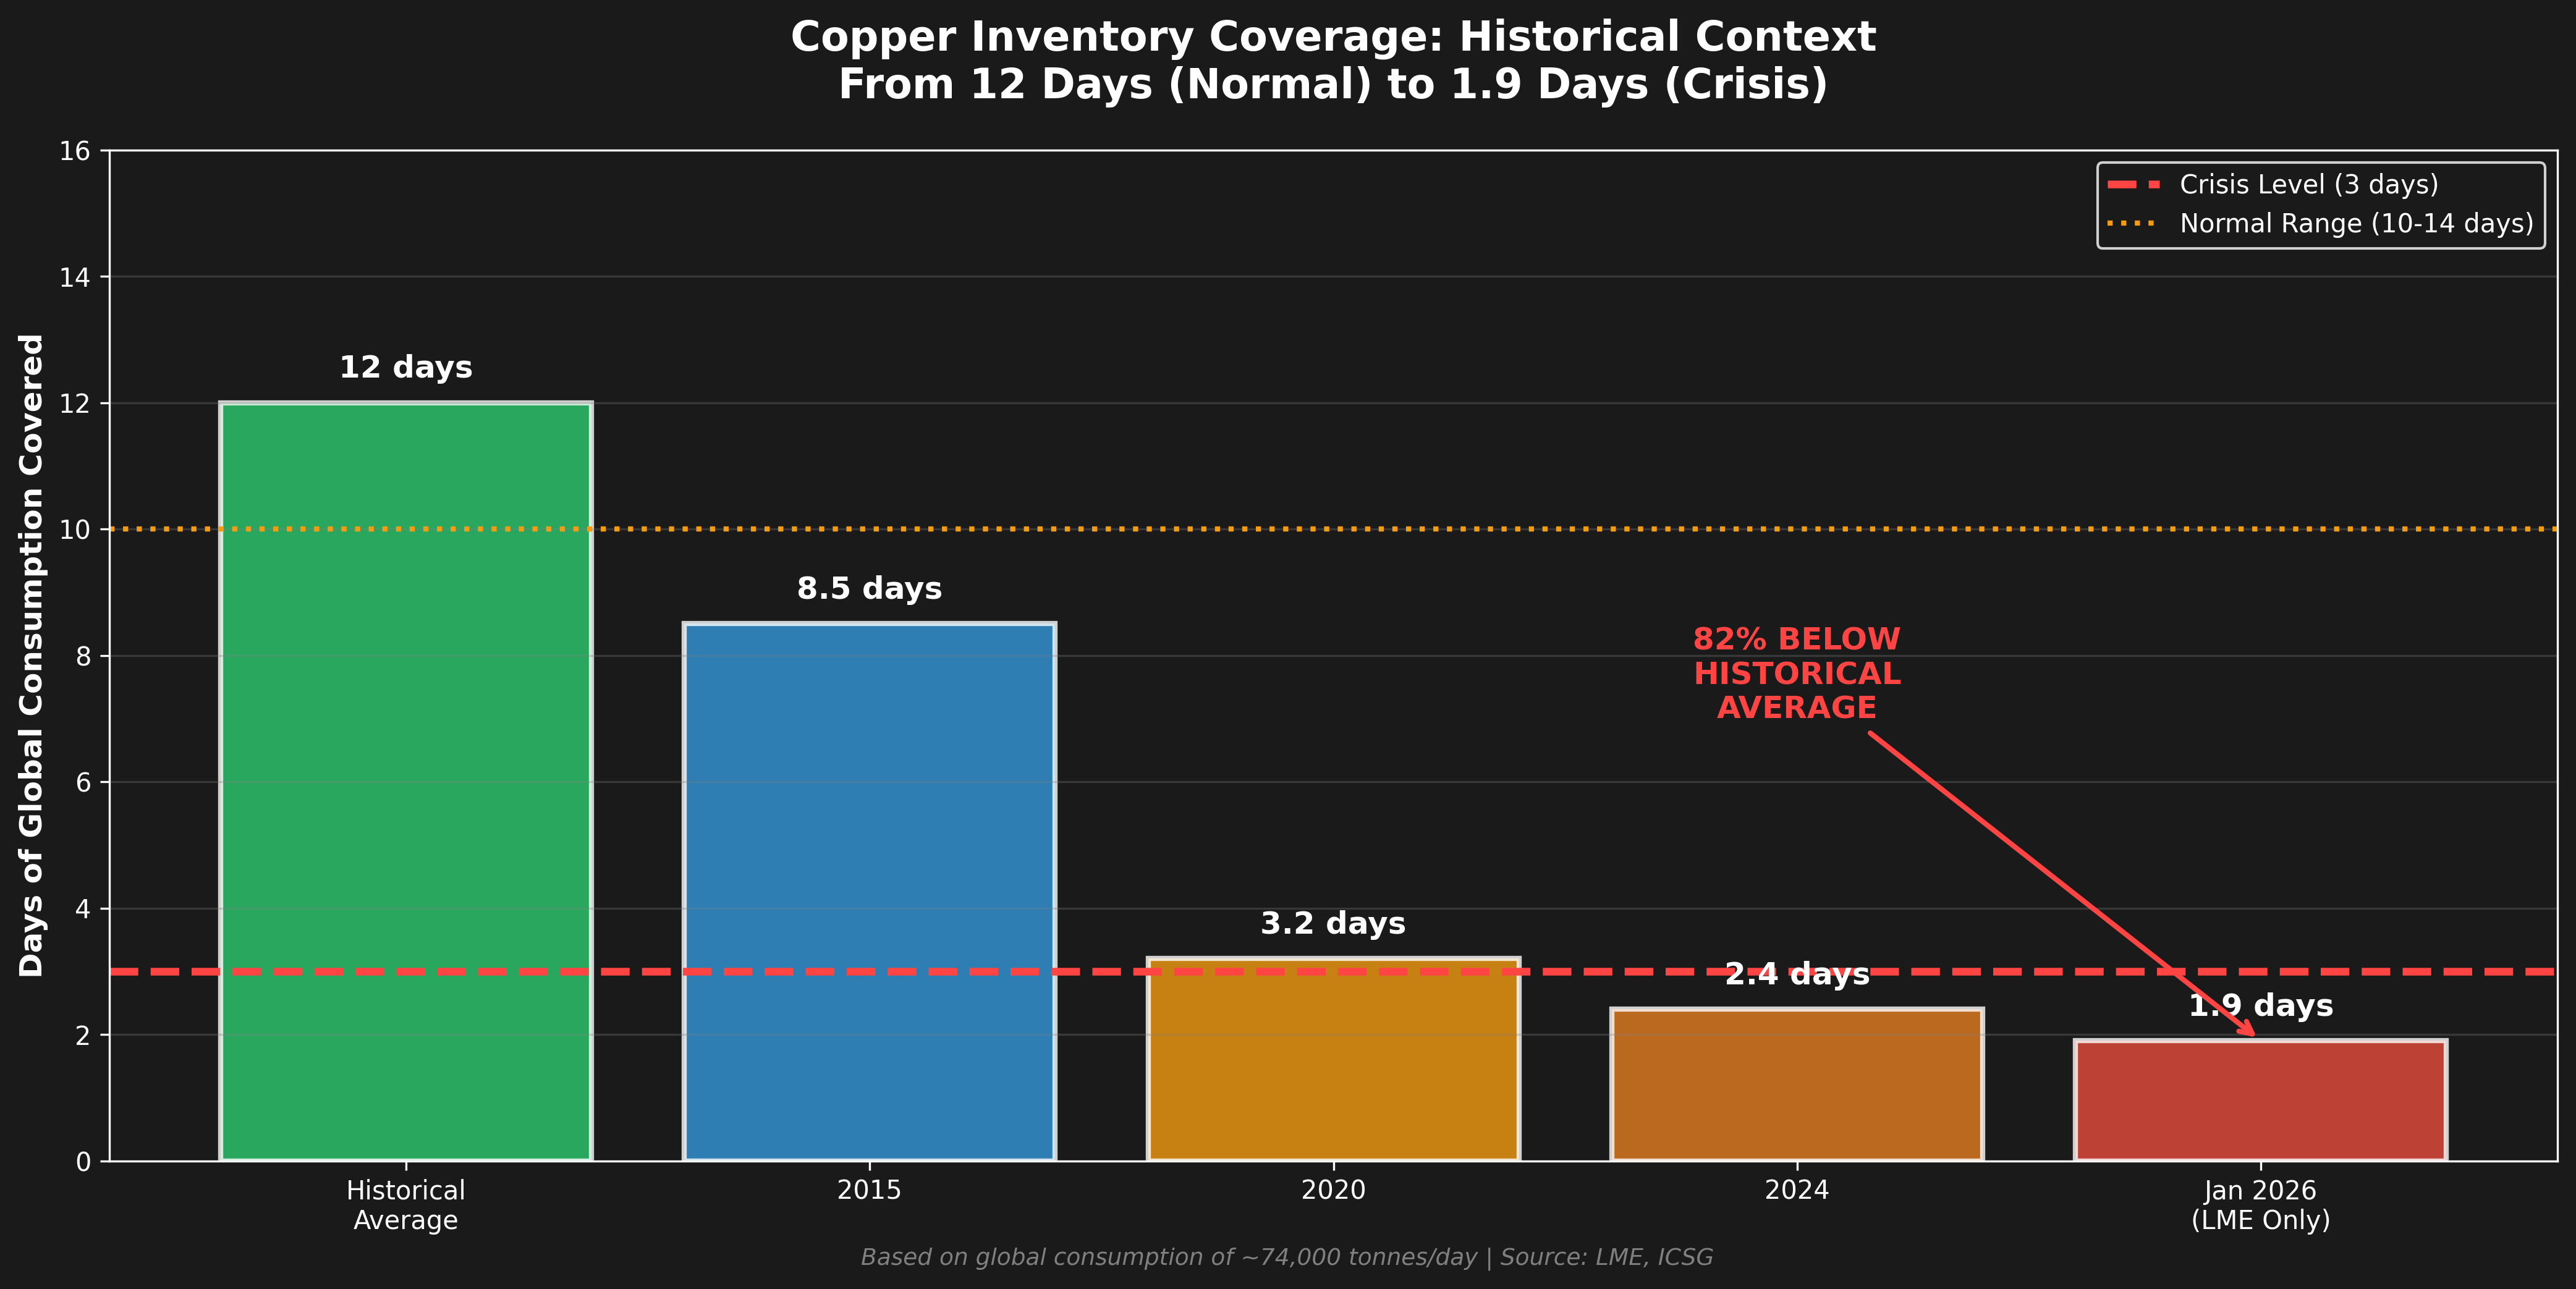 From 12 days of coverage (historical average) to just 1.9 days (Jan 2026). Current LME stocks cover 82% fewer days of consumption than normal levels.
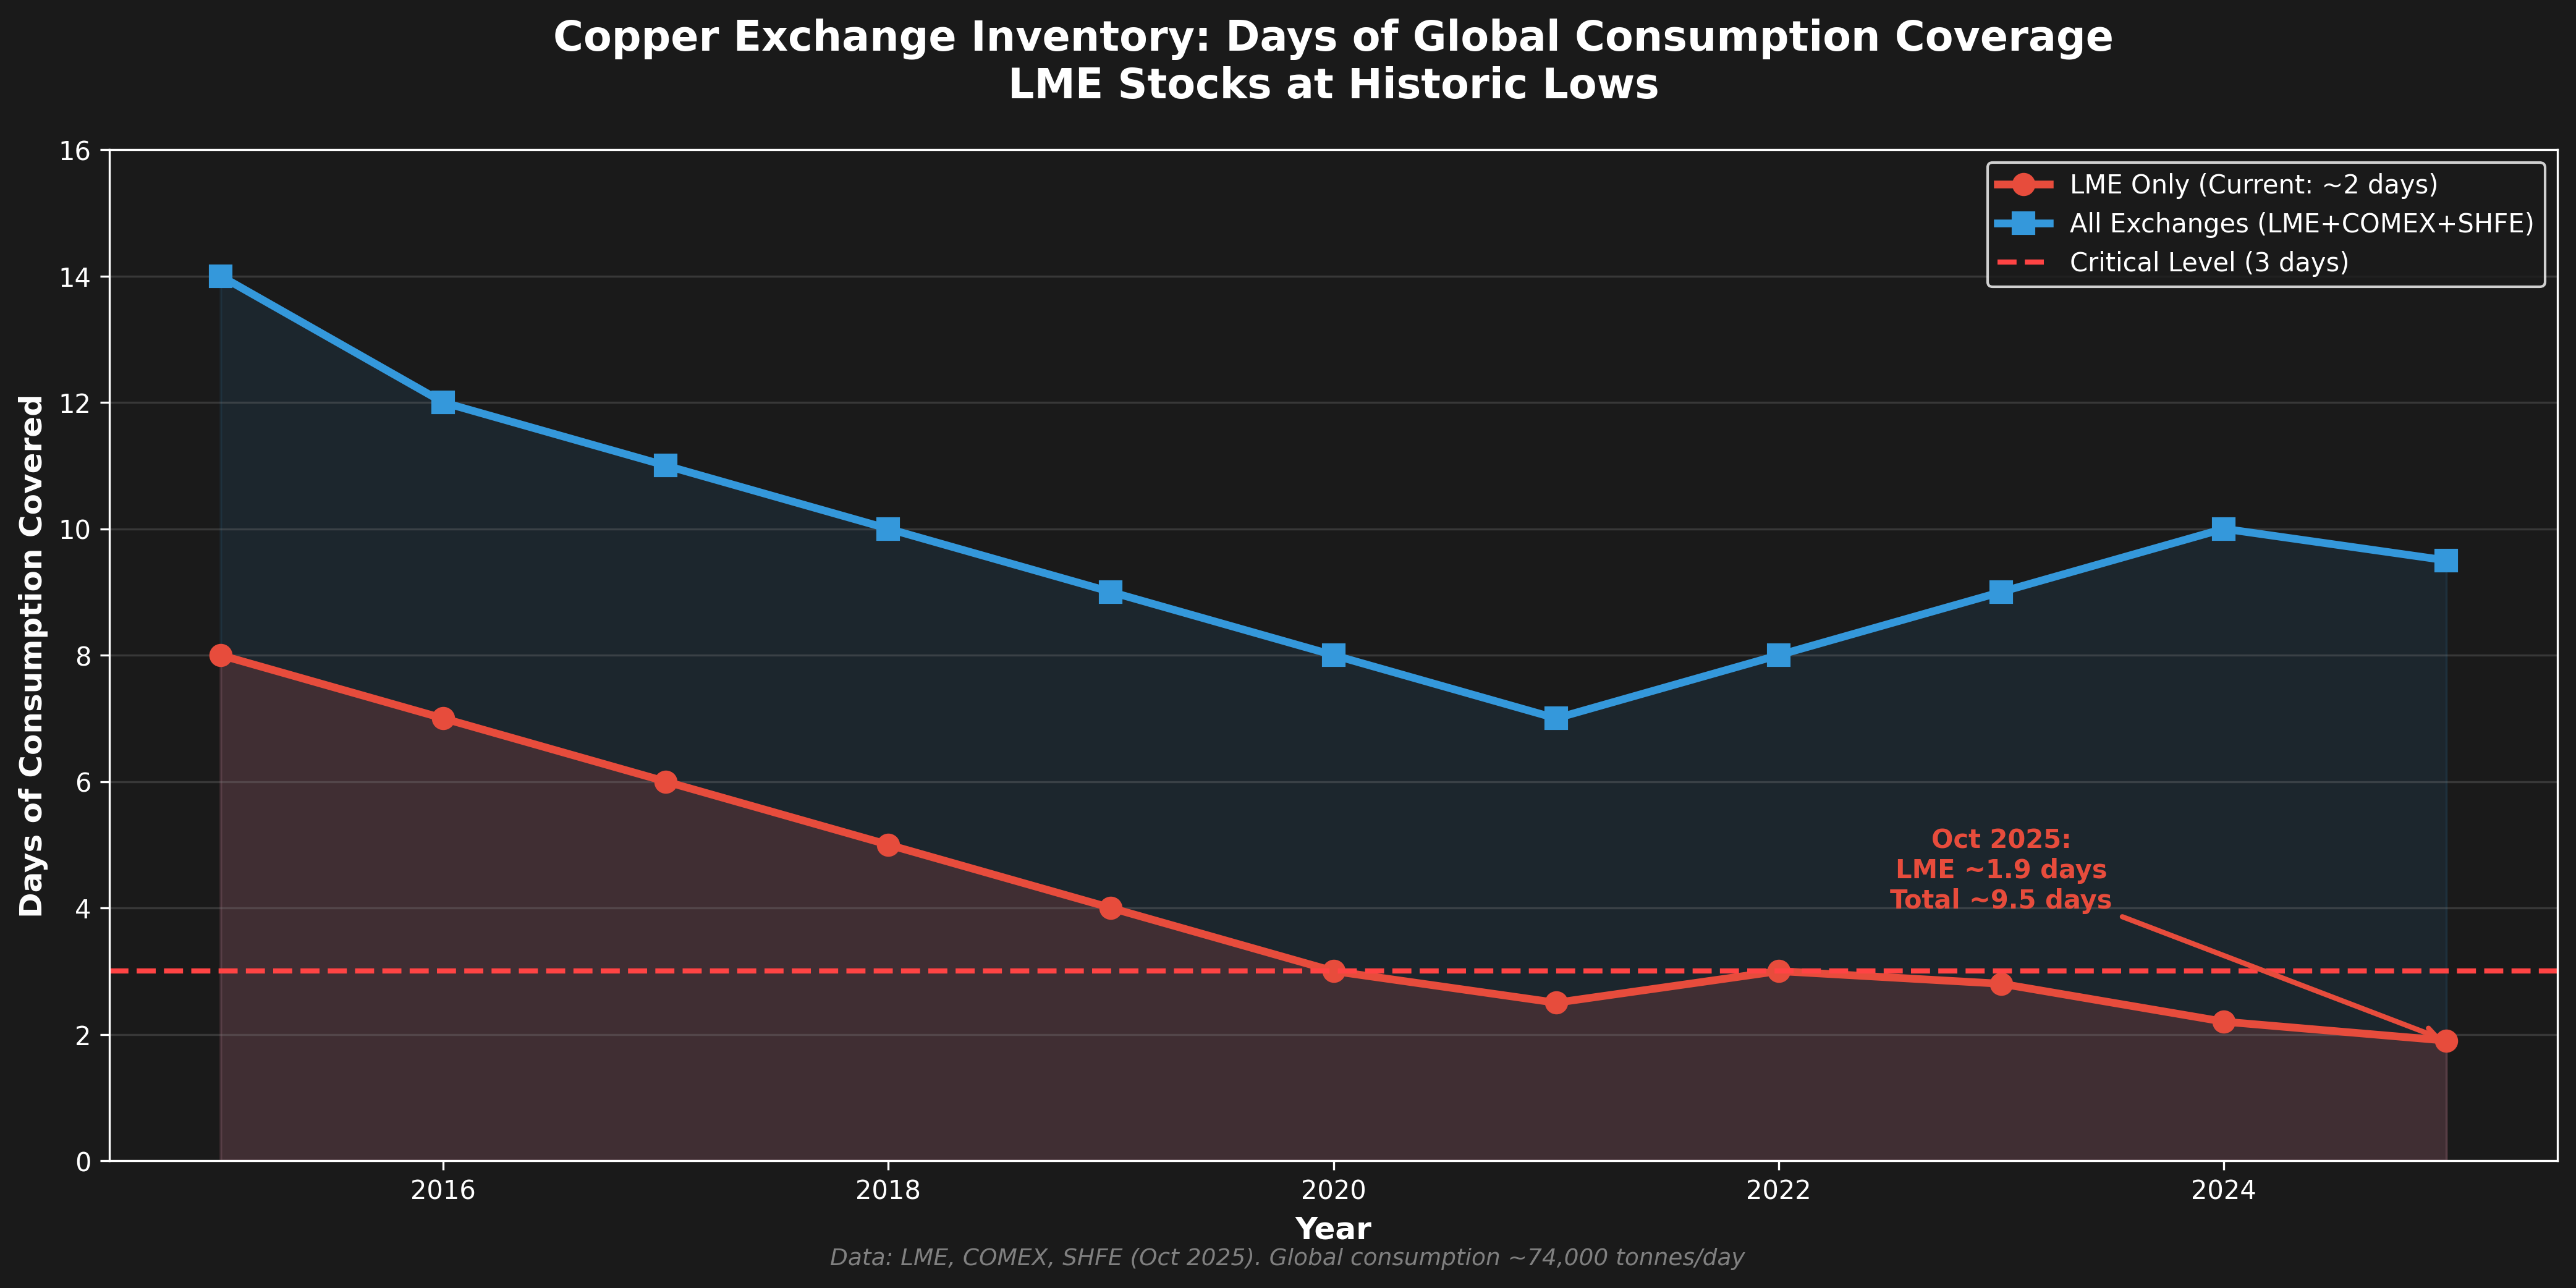 LME-only stocks (red) have fallen to ~2 days of coverage (Oct 2025), while total exchange stocks (blue) cover ~9.5 days. Below 3 days = crisis territory. Data: LME, COMEX, SHFE.
Hidden Stocks and Chinese Bonded Warehouses
Not all copper sits on exchanges. There’s “hidden” inventory—metal held by producers, consumers, and traders outside the warehouse system. Chinese “bonded warehouse” stocks (material held in customs-free zones) have historically averaged around 500,000 tonnes. But in 2025, much of this metal was redirected to the U.S. due to tariff arbitrage opportunities.
The point is: even accounting for hidden stocks, the total inventory position is historically tight. There’s no secret hoard of copper waiting to flood the market if prices rise.
Strategic Stockpiling
China appears to be building strategic copper reserves. Estimates suggest Chinese state stockpiles could hold up to 2 million tonnes—roughly a month of the country’s consumption. In February 2026, Chinese industry associations openly called for expanding these reserves and creating a commercial stockpiling system.
The U.S. has responded with “Project Vault”—a $12 billion program to establish strategic raw material reserves including copper. When governments start stockpiling, it sends a signal about expected future scarcity.
The Market Structure: How Copper Actually Trades
Understanding copper’s price action requires grasping how the market is structured. This isn’t like trading GLD or SLV. Copper has multiple trading venues, complex delivery mechanics, and regional price differences that matter enormously.
The Three Exchanges
COMEX (CME Group): The most liquid copper futures market globally. Contracts are 25,000 pounds, priced in U.S. cents per pound. COMEX is primarily a financial hedging venue—hedge funds, speculators, and some commercial users trade here. The contract requires physical delivery of Grade 1 cathode to approved U.S. warehouses.
LME (London Metal Exchange): The global physical price reference since 1966. LME contracts are 25 metric tonnes, and the exchange operates a unique “prompt date” system where delivery can occur on any business day (not just monthly). The LME Official Price—set during the second morning “Ring” (open outcry session)—is the benchmark for most physical copper contracts worldwide.
SHFE (Shanghai Futures Exchange): The Asian hub. Chinese futures dominate regional trade, and Chinese traders increasingly influence global flows. SHFE contracts are 5 metric tonnes, priced in yuan.
Contango vs. Backwardation
These terms describe the shape of the futures curve:
-
Contango: Futures price > spot price (upward sloping curve). This signals adequate supply, weak near-term demand, and incentives to store metal. It costs money to carry inventory (storage + financing), so futures should trade above spot in a well-supplied market.
-
Backwardation: Spot price > futures price (downward sloping curve). This signals tight physical supply, strong immediate demand, and a “convenience yield”—the value of having metal available right now rather than later.
Currently, copper markets are showing signs of backwardation, particularly in the prompt months. The Shanghai Futures Exchange showed a 260-300 yuan per tonne backwardation between July and August 2025 contracts. This is screaming “tightness” in the physical market.
When you see persistent backwardation while prices are making new highs, it suggests genuine supply scarcity rather than speculative bubble. Speculators tend to push curves into contango. Industrial users scrambling for physical metal cause backwardation.
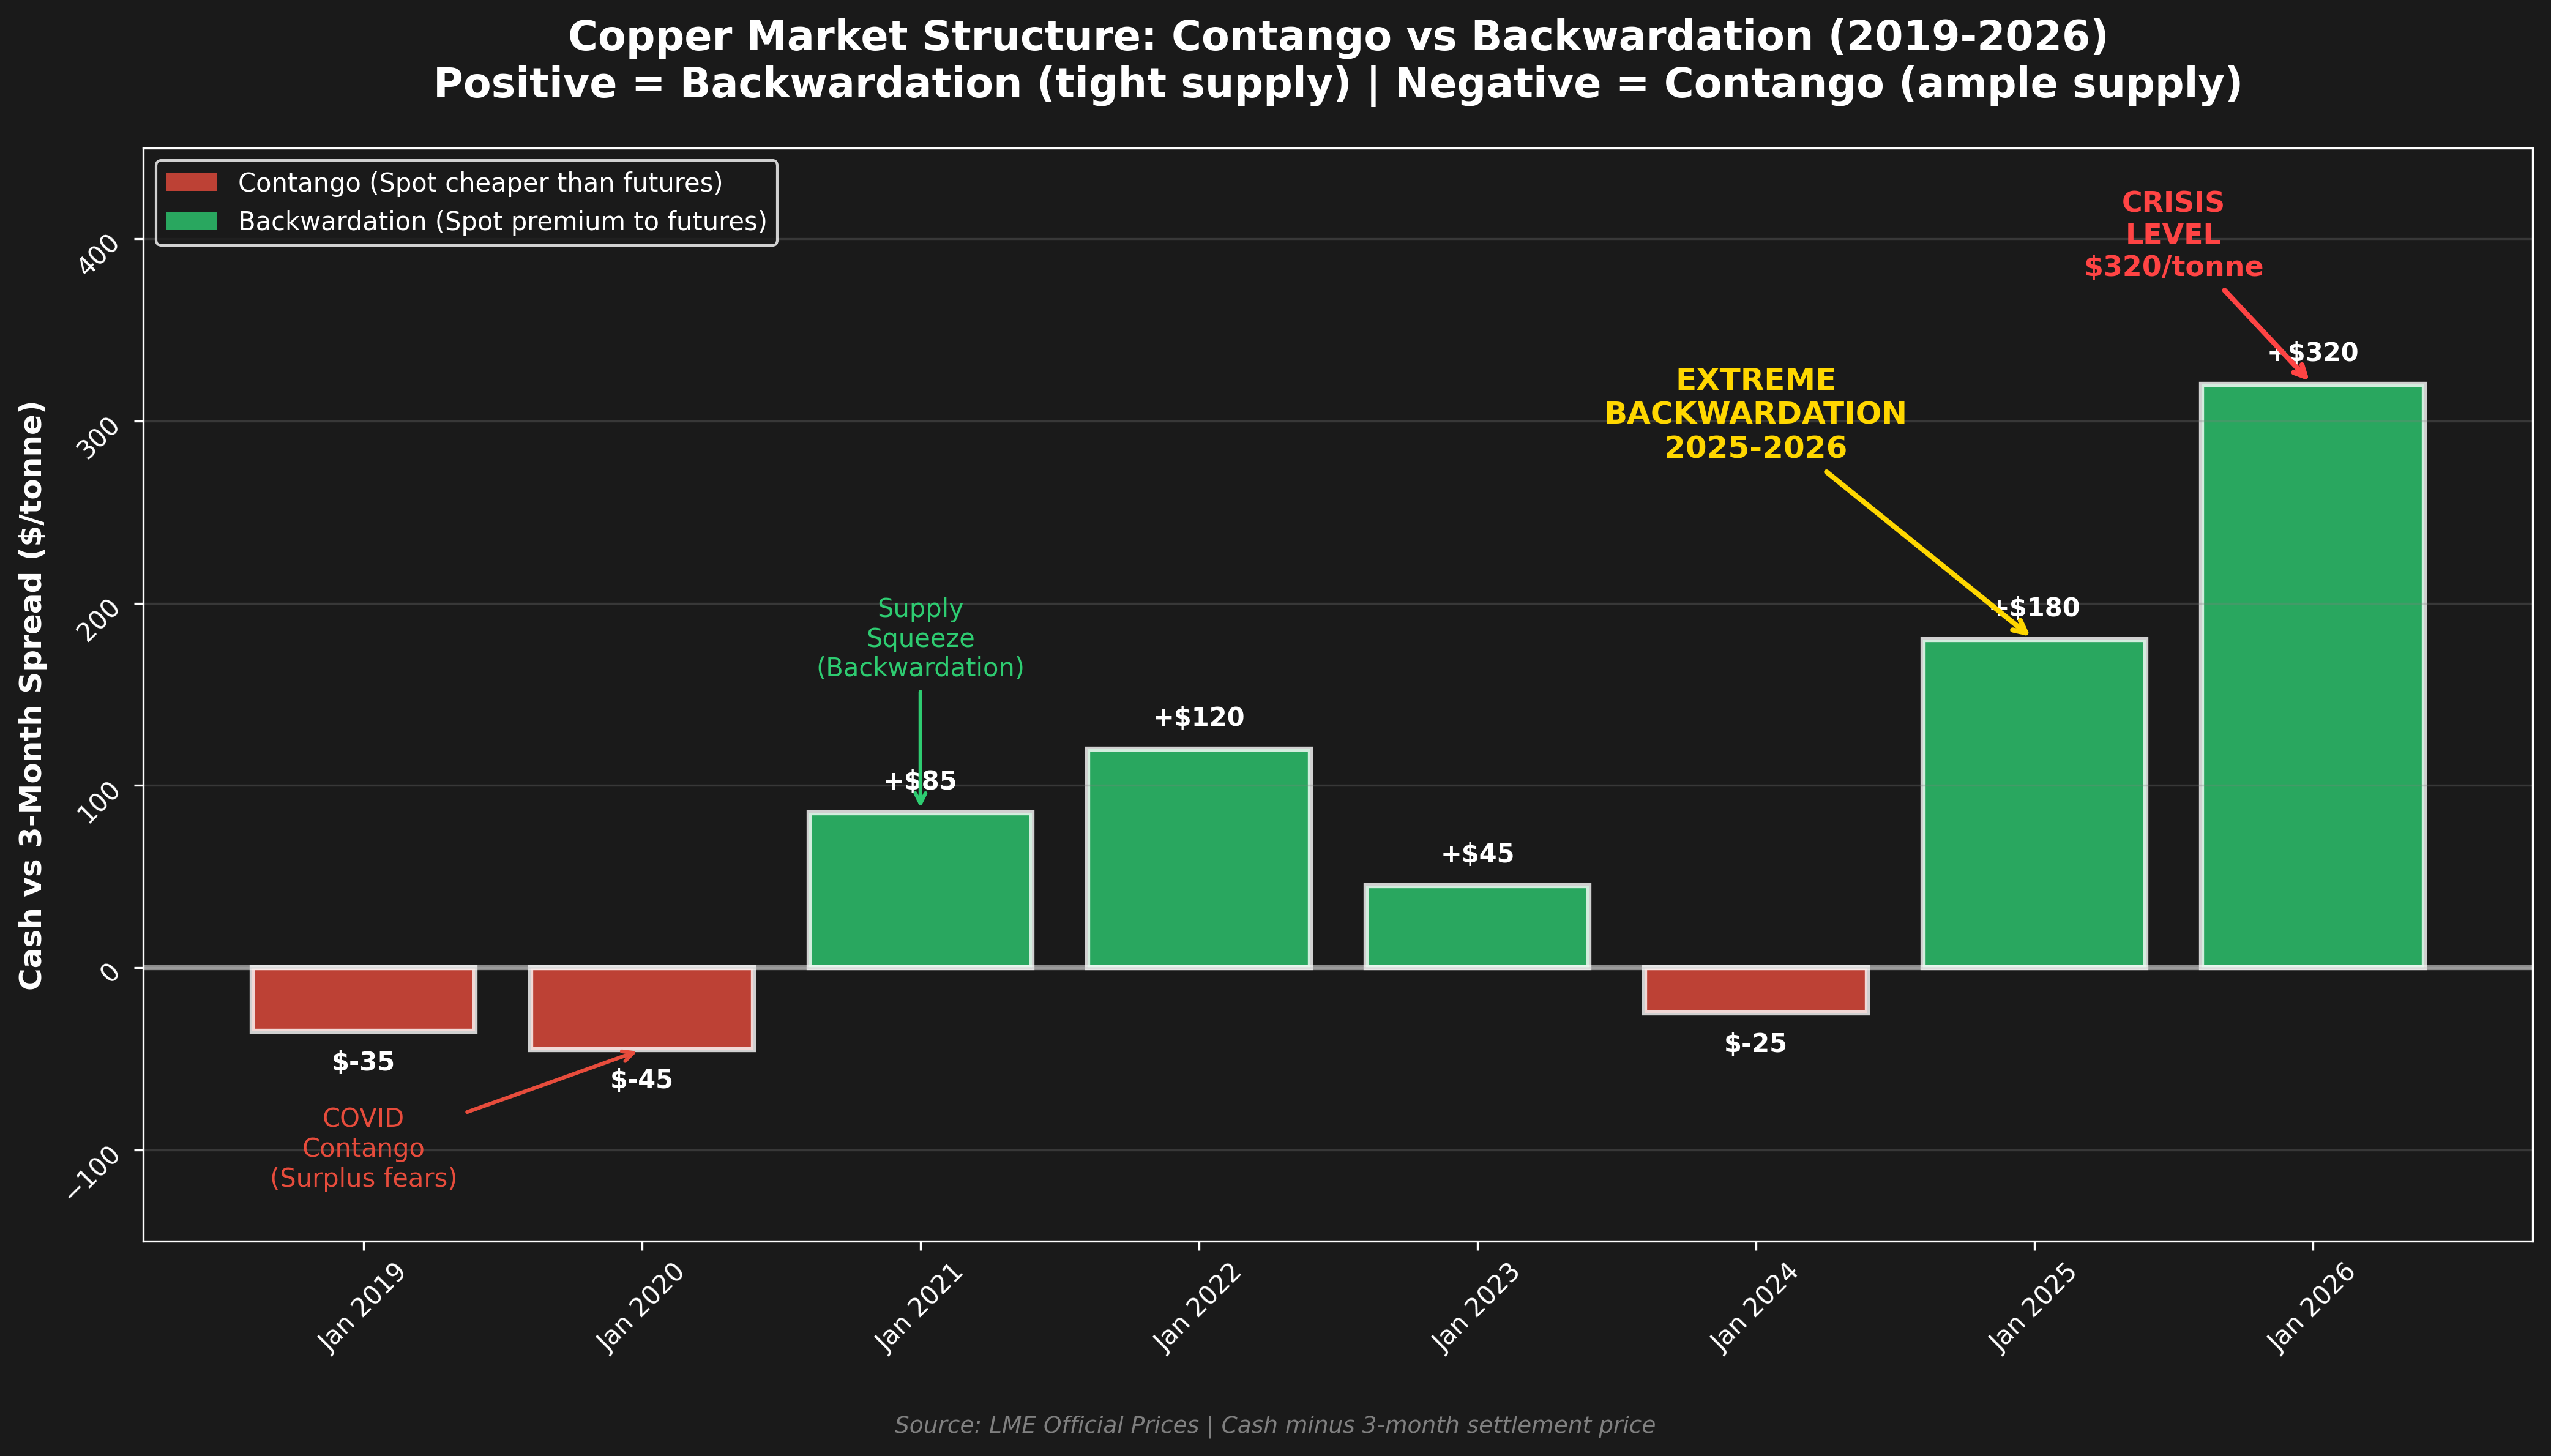 Historical cash vs 3-month spreads show the shift from contango (2019-2020, surplus fears) to extreme backwardation (2025-2026, supply crisis). The $320/tonne backwardation in Jan 2026 signals unprecedented tightness.
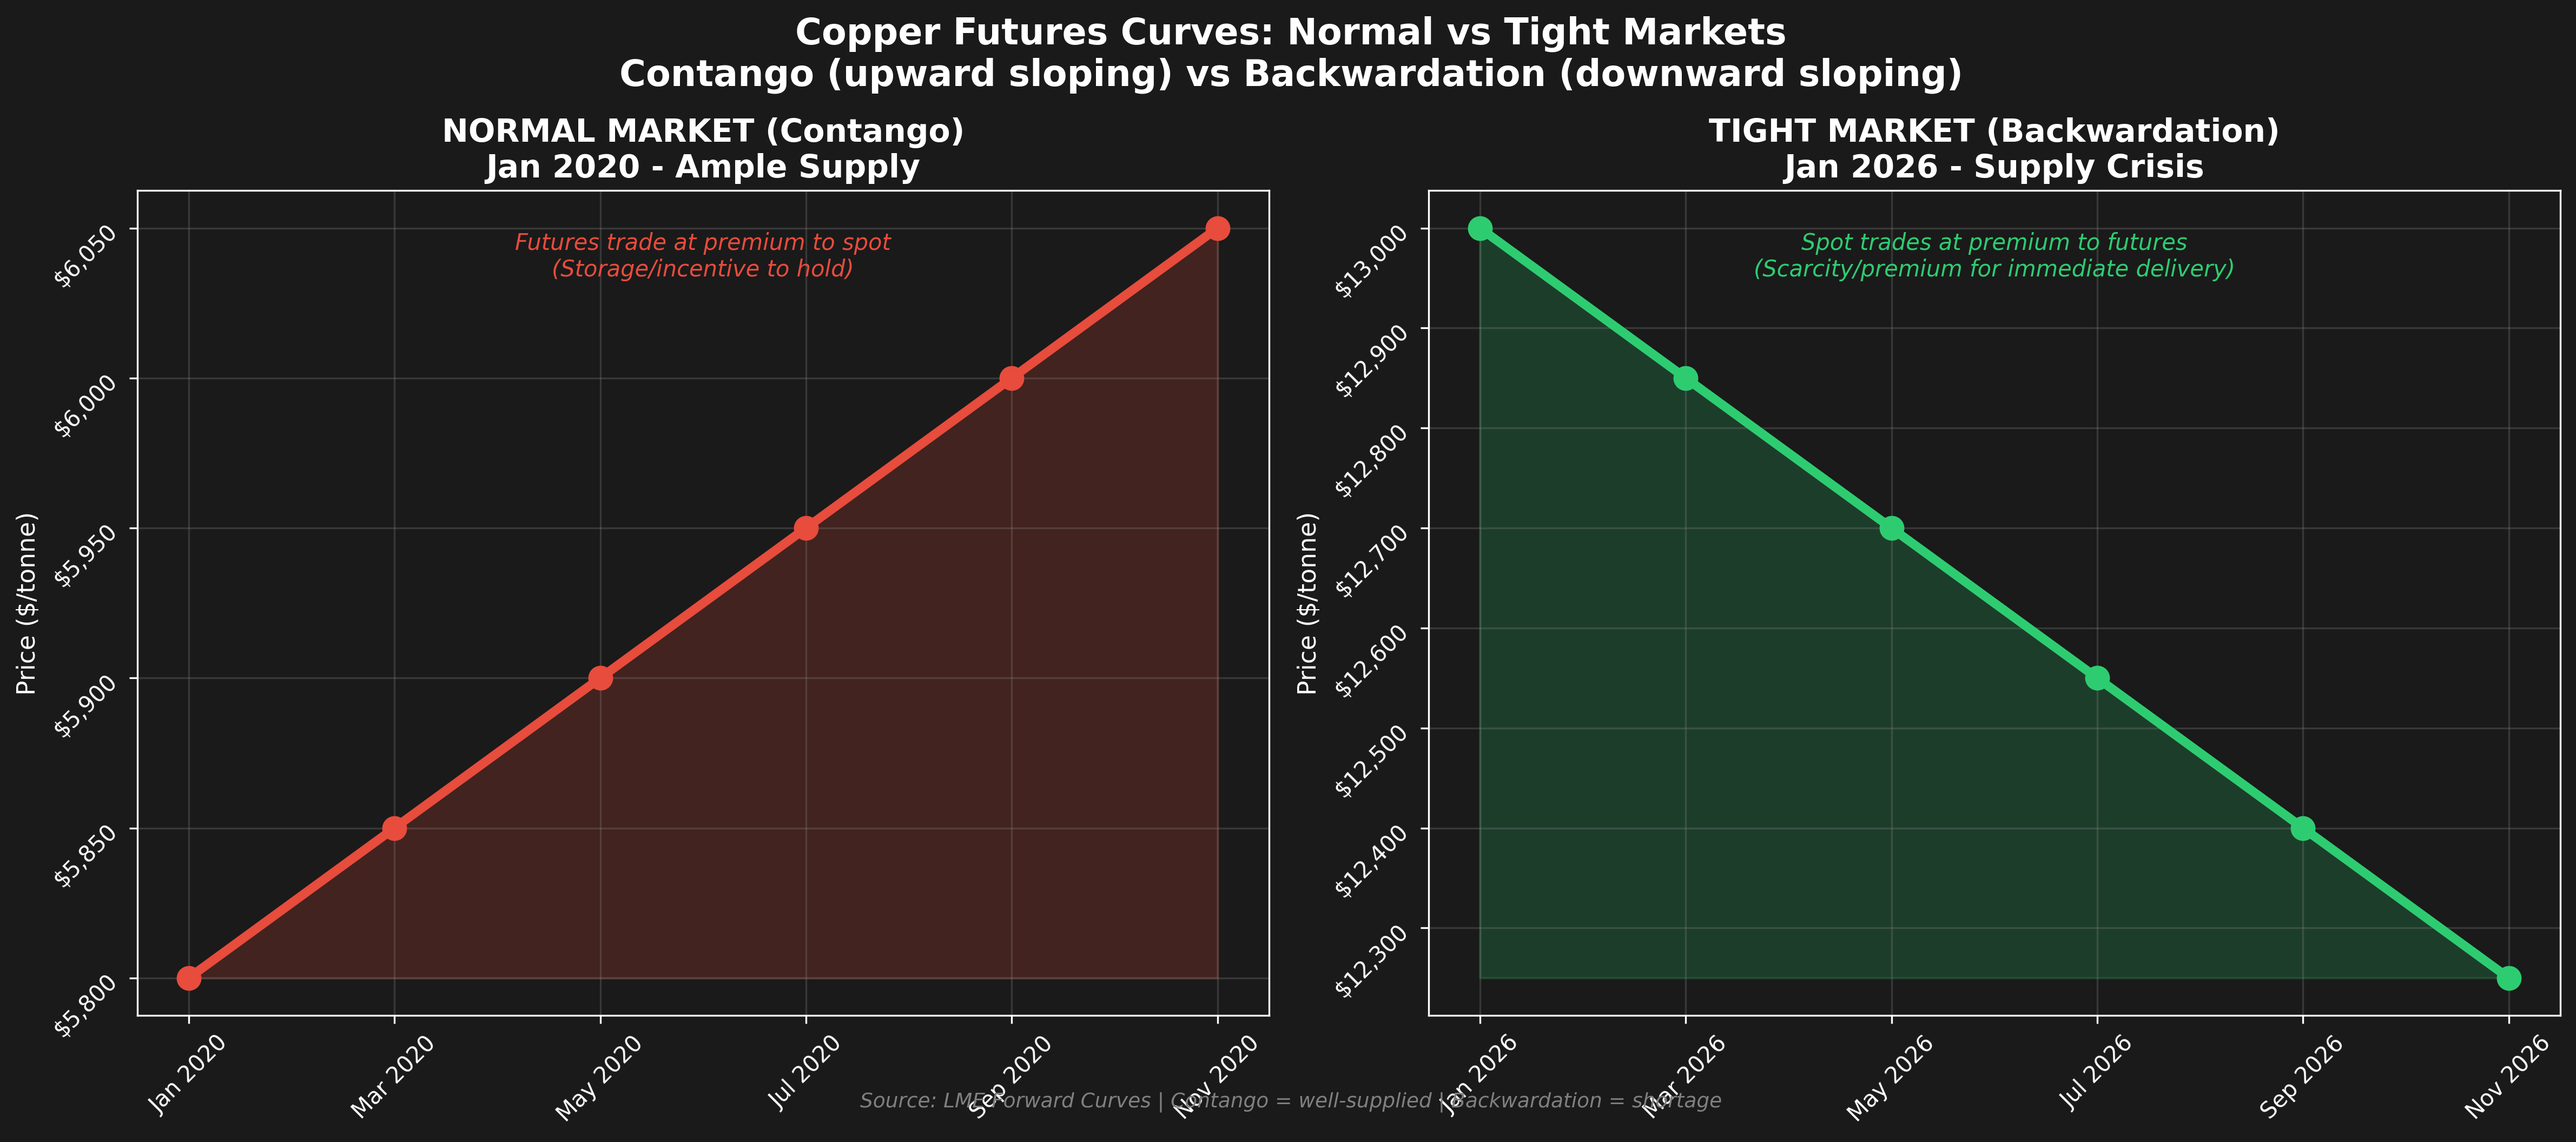 Contango (Jan 2020): Upward sloping curve with futures trading at premium—signals adequate supply. Backwardation (Jan 2026): Downward sloping curve with spot at $900/tonne premium—signals physical shortage.
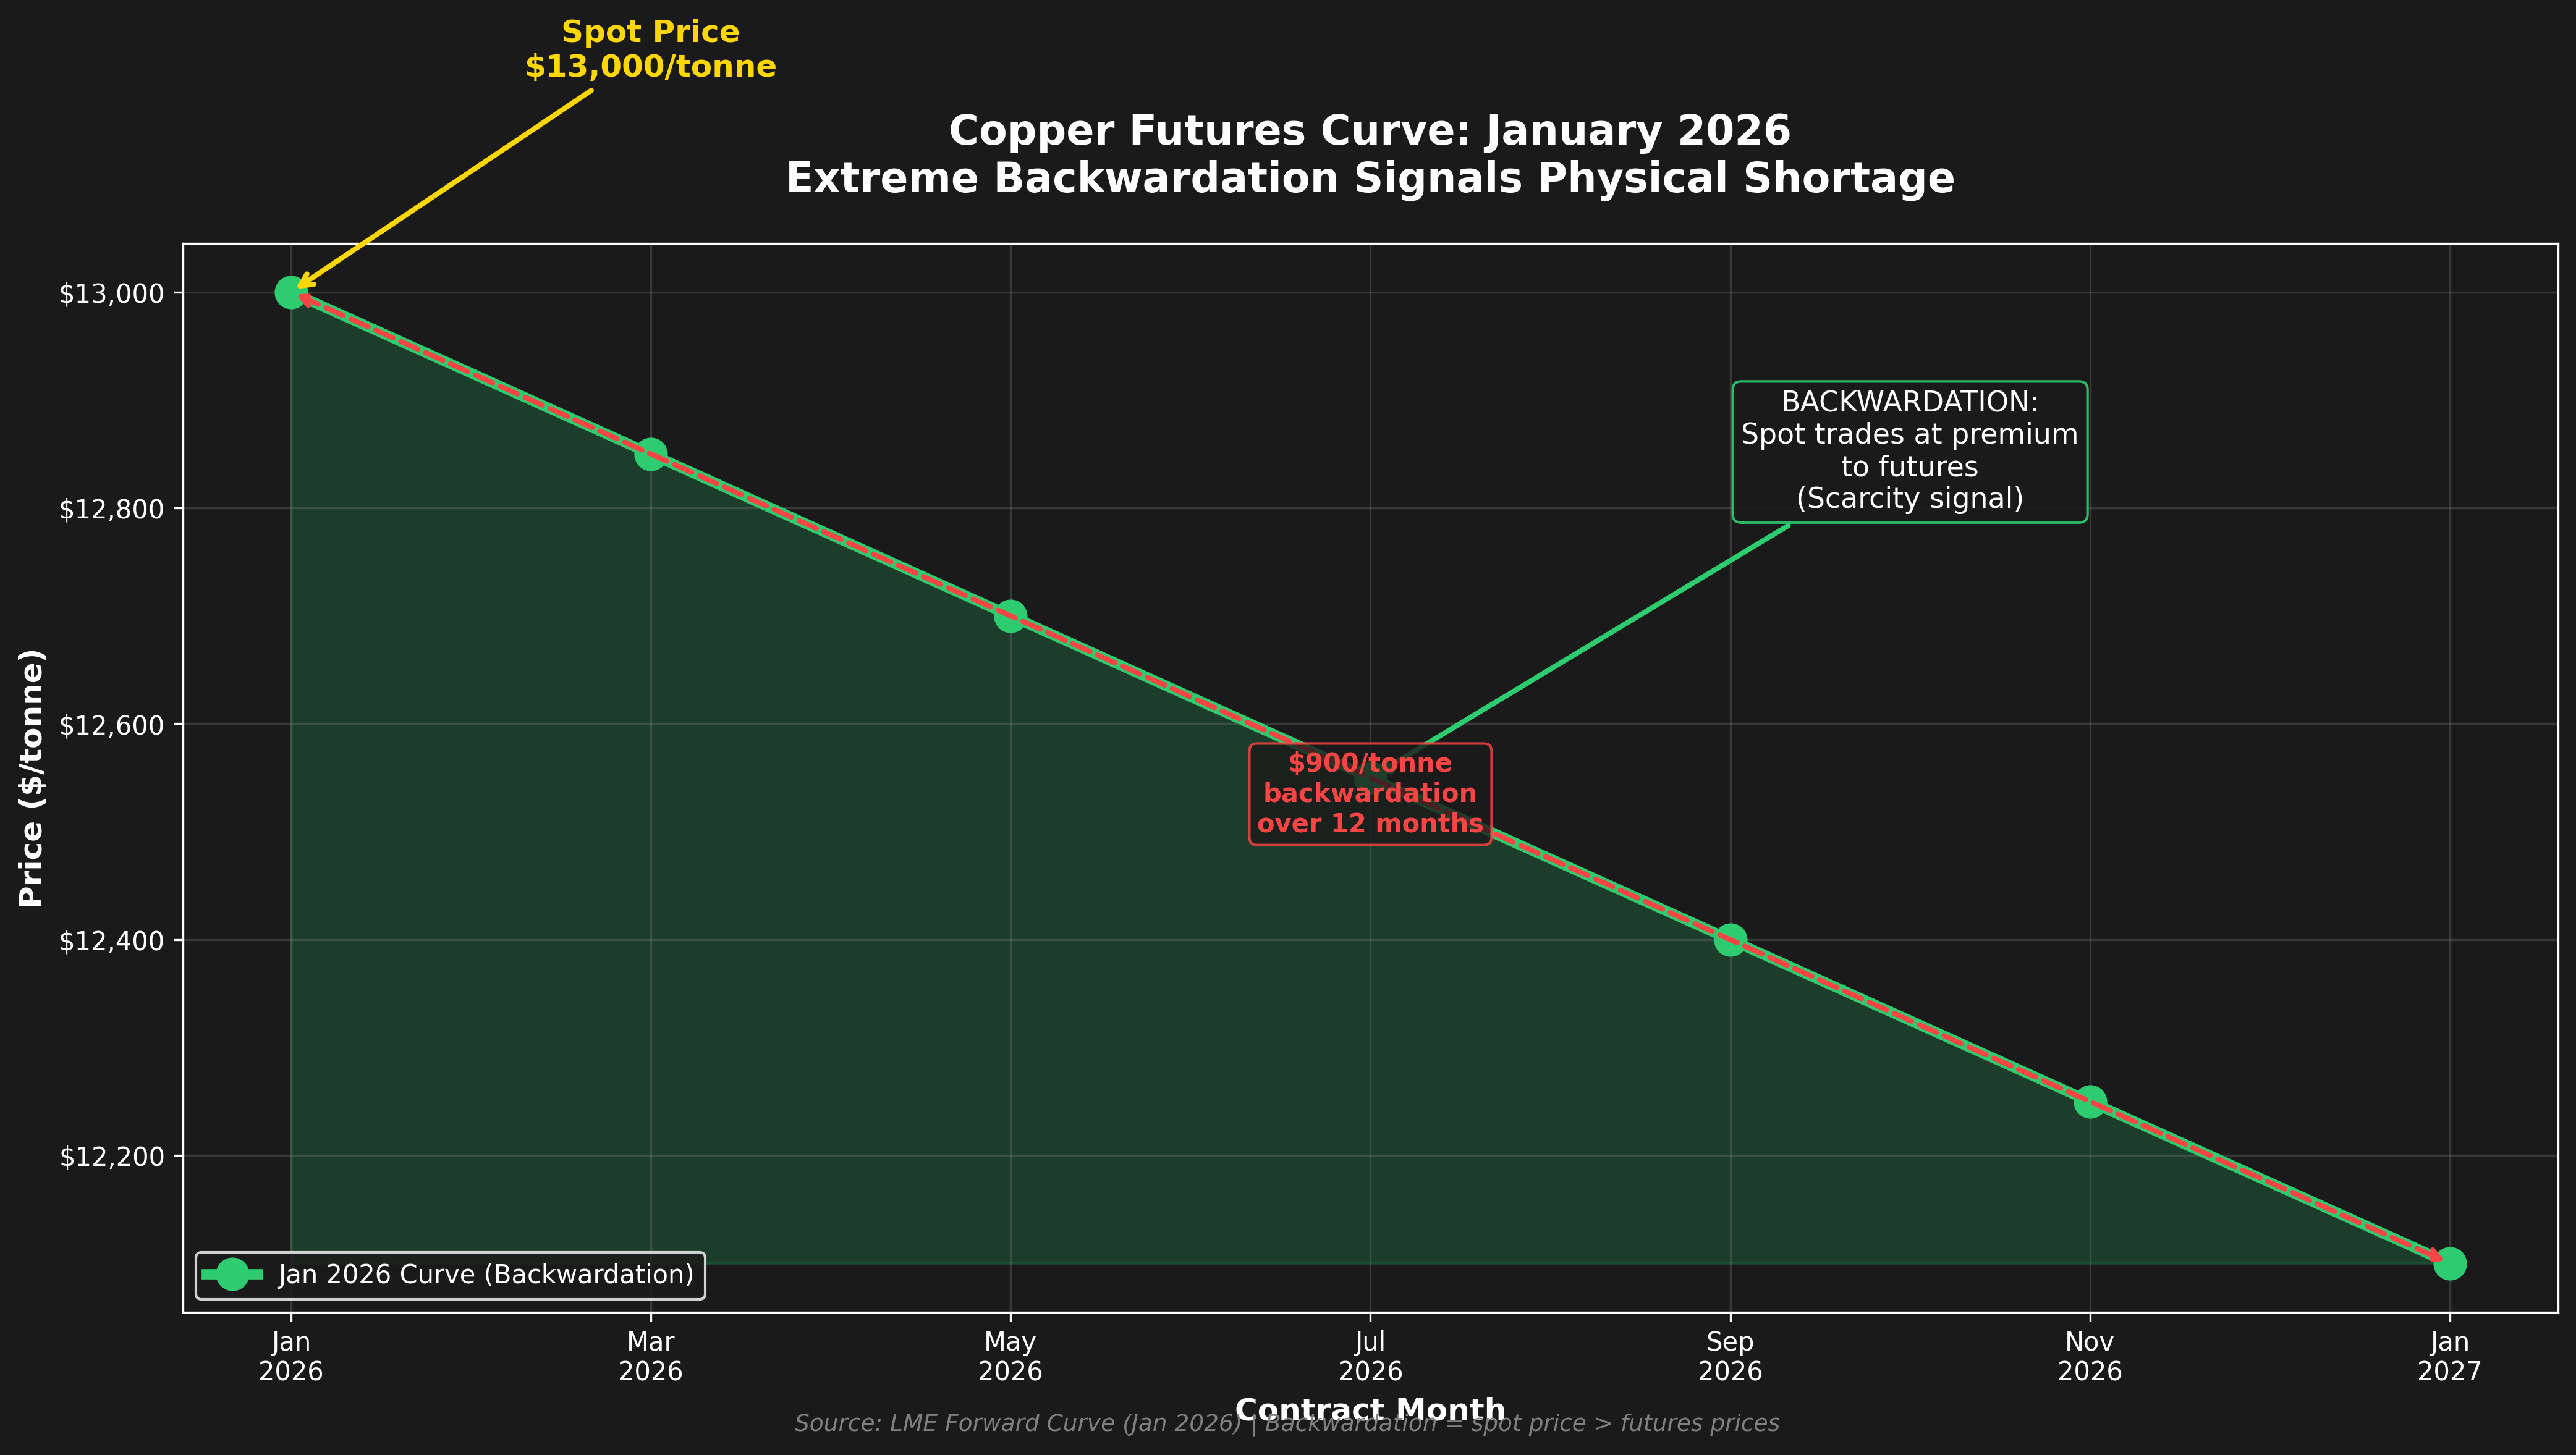 January 2026 LME forward curve showing extreme backwardation. Spot price ($13,000/tonne) trades at $900 premium to Jan 2027 contracts. This ‘convenience yield’ reflects the premium buyers pay for immediate availability.
Regional Arbitrage and the Shanghai Premium
Copper prices aren’t uniform globally. The “Shanghai Premium” is the amount Chinese buyers pay above the LME benchmark for copper delivered to Shanghai. When Chinese demand is strong and local supply tight, this premium expands. When Chinese demand weakens, the premium contracts—or even goes negative.
In 2025, China has actually been a net exporter of roughly 580,000 tonnes of copper—more than all of 2024’s exports combined. This material flowed to the U.S. due to tariff fears and arbitrage opportunities. When copper flows out of China rather than into it, that’s historically been a bearish signal for global demand. But this time, it’s being driven by trade policy (tariff arbitrage) rather than weak Chinese demand.
Why Delivery Mechanics Matter
Unlike gold ETFs where shares trade electronically against vaulted metal, copper futures can result in physical delivery. If you hold a long COMEX or LME position into expiration, you might end up with warrants representing ownership of actual copper cathode in a warehouse.
This matters because:
-
Futures must converge to physical prices at expiration. You can’t have a massive disconnect because arbitrageurs will take delivery or make delivery to profit from the difference.
-
Warehouse availability affects pricing. If COMEX warehouses are full (as they are now in 2025), it’s harder to arbitrage price discrepancies.
-
Brand specifications matter. Only certain approved brands can be delivered against futures. In tight markets, non-deliverable brands might trade at significant discounts because they can’t be used to settle short positions.
Historical Context: Cycles, Supercycles, and What Comes Next
Copper is a notoriously cyclical commodity. Understanding where we are in the cycle requires looking back at how copper markets have behaved historically.
The Four Commodity Supercycles
Commodity supercycles are extended periods (10-30 years) where prices trend significantly above or below long-term averages. There have been four major supercycles:
- 1899-1932: U.S. industrialization and railroad expansion
- 1933-1957: WWII rearmament and post-war reconstruction
- 1968-1982: European and Japanese industrialization
- 1996-2011: China-led urbanization
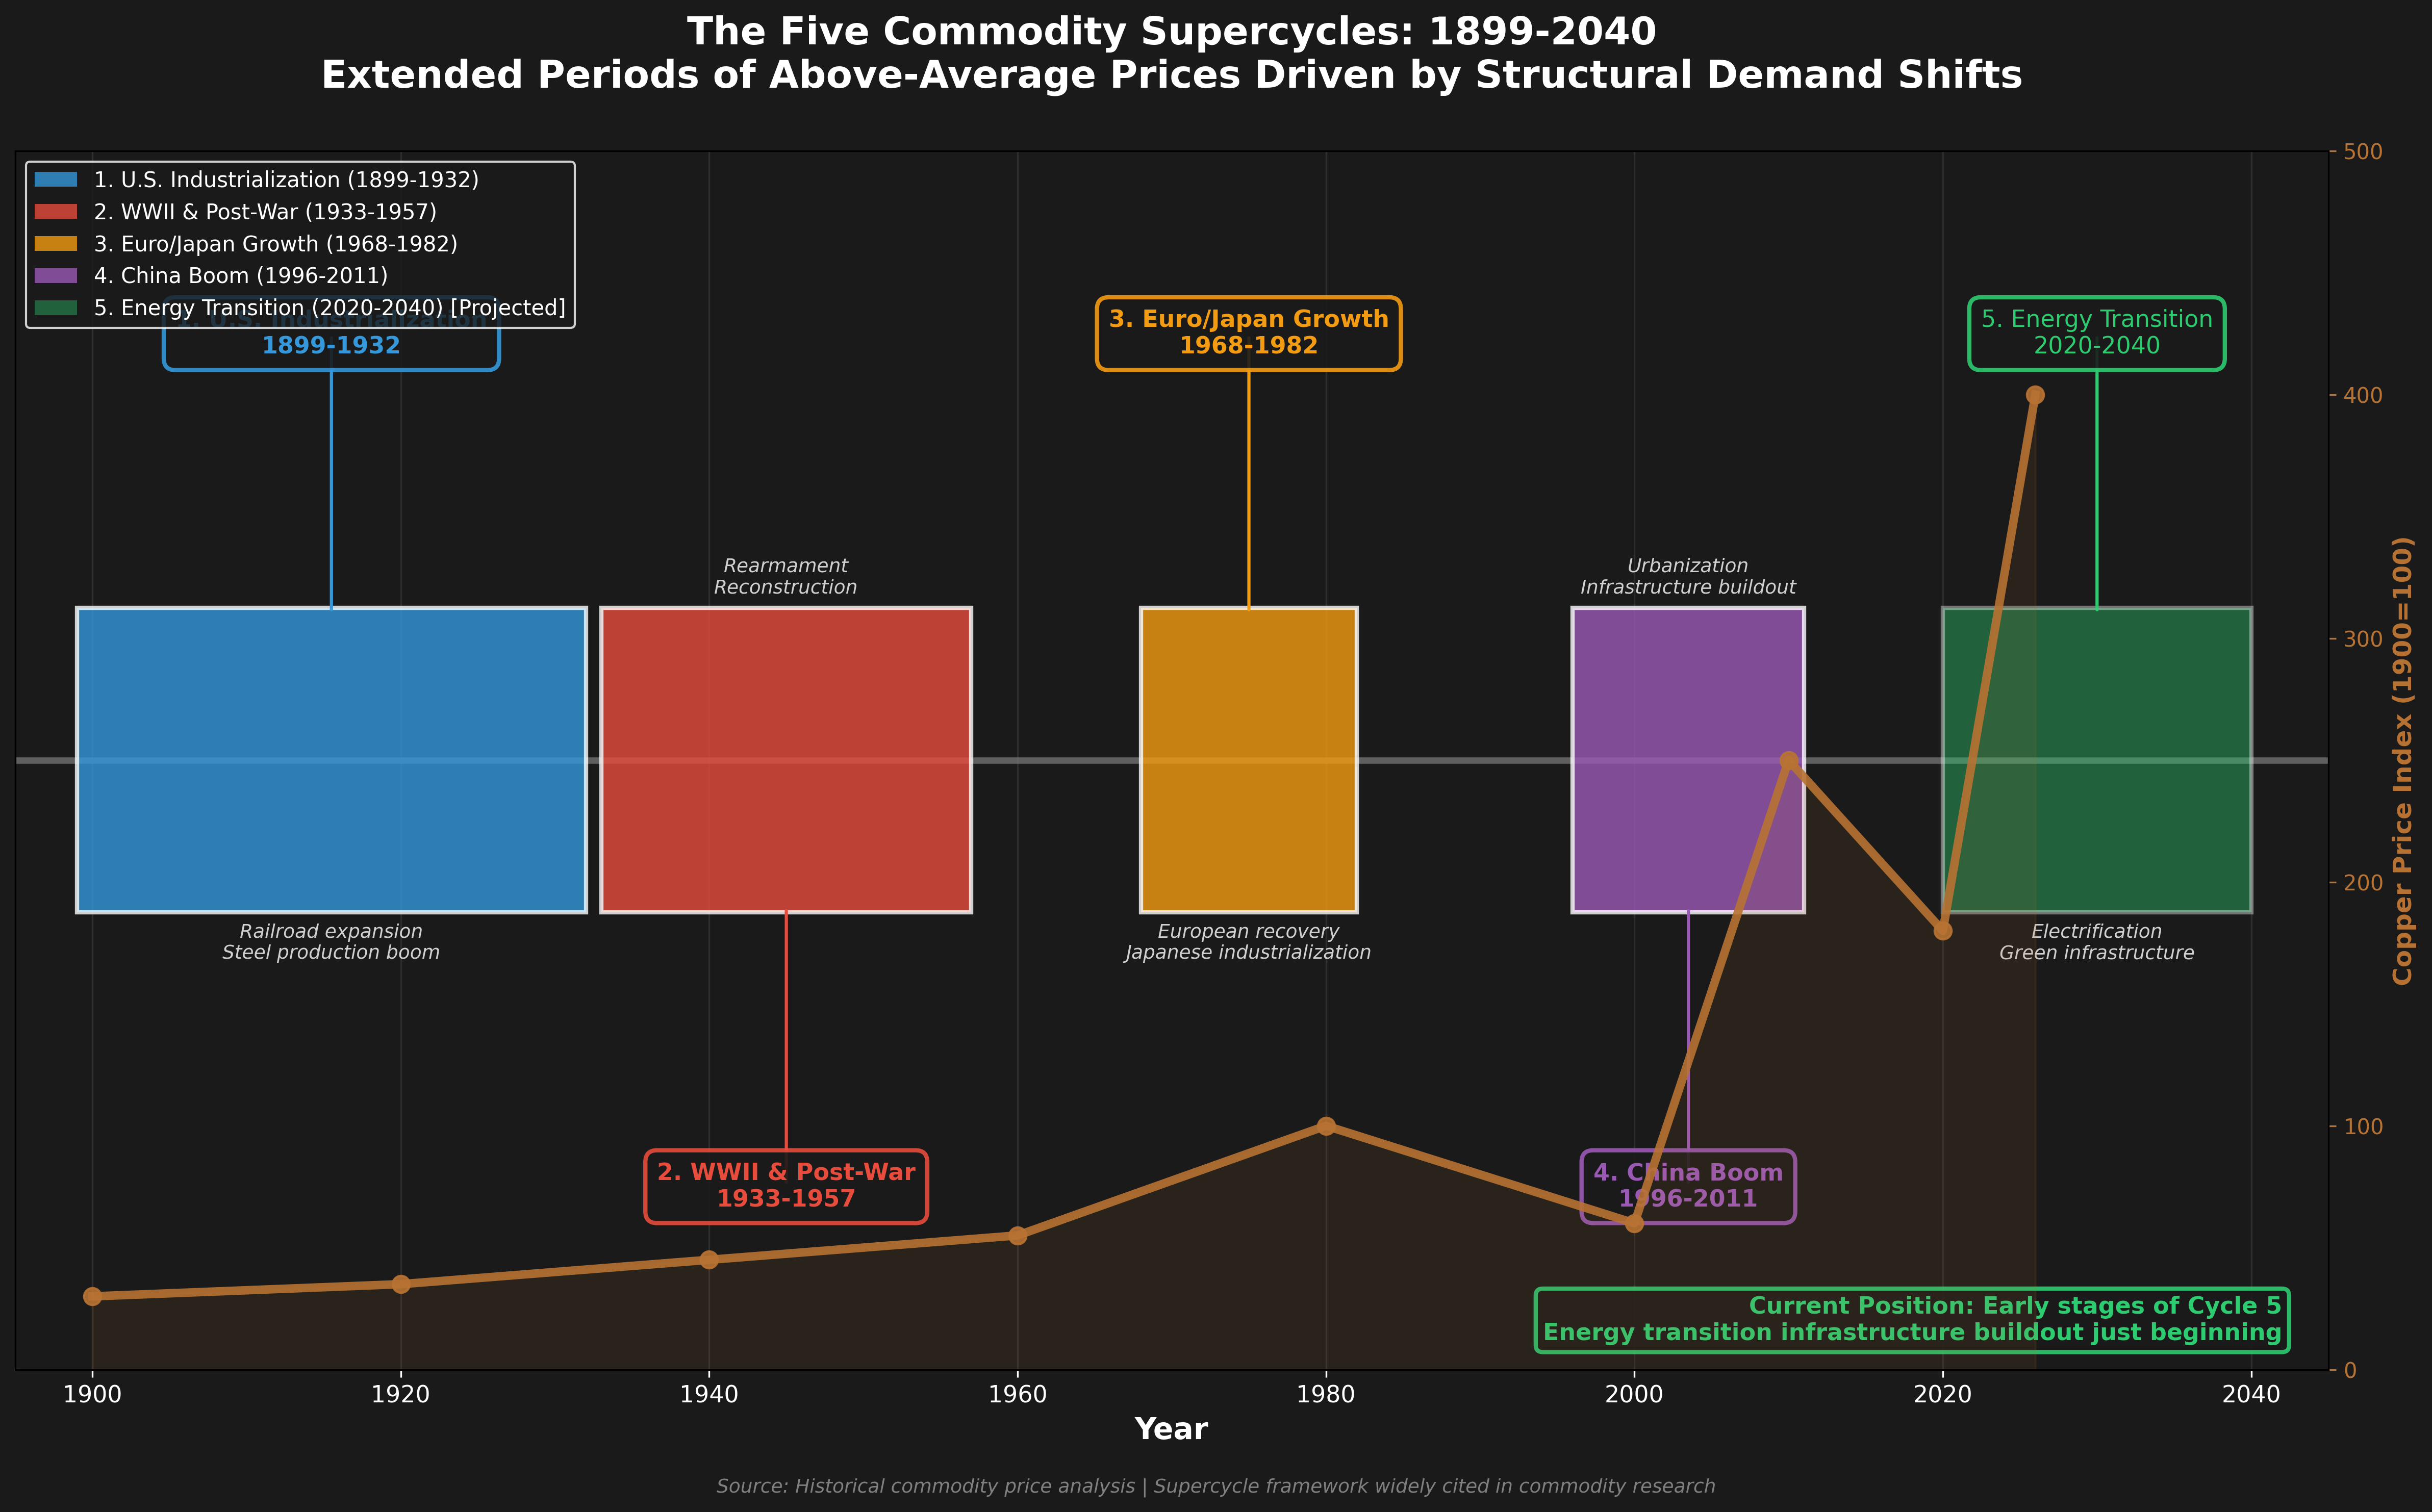 Five major commodity supercycles over 140+ years. Each driven by massive structural shifts in global demand. The current Cycle 5 (Energy Transition) is just beginning, with copper price index showing early acceleration.
We’re potentially entering the fifth: the energy transition supercycle.
The China Boom (2003-2011)
The last copper supercycle was driven by China’s urbanization. Between 2003 and 2011, copper prices rose from roughly $1,500/tonne to over $10,000/tonne—a nearly sevenfold increase.
China was urbanizing 20 million people per year, building 3 billion square meters of floor space annually, and consuming 40% of global copper. Australian iron ore exports to China went from near zero to $60 billion per year. Chilean copper exports went from $1 billion to $20 billion.
The 2011 peak ($8,823/tonne annual average, $10,100/tonne at the highs) marked the top of that cycle. Prices then declined for five years, bottoming in 2016 at $4,868/tonne.
The Pandemic Era (2020-2022)
COVID-19 created a unique dynamic. Supply disruptions (mine closures, logistics bottlenecks) coincided with massive green stimulus spending and EV adoption acceleration. Copper hit an all-time high of $10,730/tonne in May 2021, then spiked again to $11,100/tonne in March 2022 following Russia’s invasion of Ukraine (energy cost inflation hits mining hard).
Where Are We Now?
As of early 2026, copper has hit new all-time highs above $13,000/tonne. But unlike previous peaks, this one is happening against a backdrop of:
- Structurally constrained supply (grades declining, political risk, no new major projects before 2028)
- Multiple simultaneous demand drivers (EVs, grid expansion, data centers, renewable energy, defense spending)
- Critically low inventories (LME stocks at multi-decade lows)
- Backwardated curves (physical tightness, not speculative excess)
Goldman Sachs forecasts copper at $11,000/tonne by end-2026, while their longer-term structural analysis targets $15,000/tonne by 2035. Citigroup sees $12,500/tonne by Q2 2026. Bank of America and other major banks forecast deficits continuing into 2026.
The long-term structural picture remains compelling: S&P Global projects a 9.9 million tonne deficit by 2035—a 25% shortfall. The IEA forecasts a 30% supply shortfall by 2035 under net-zero scenarios.
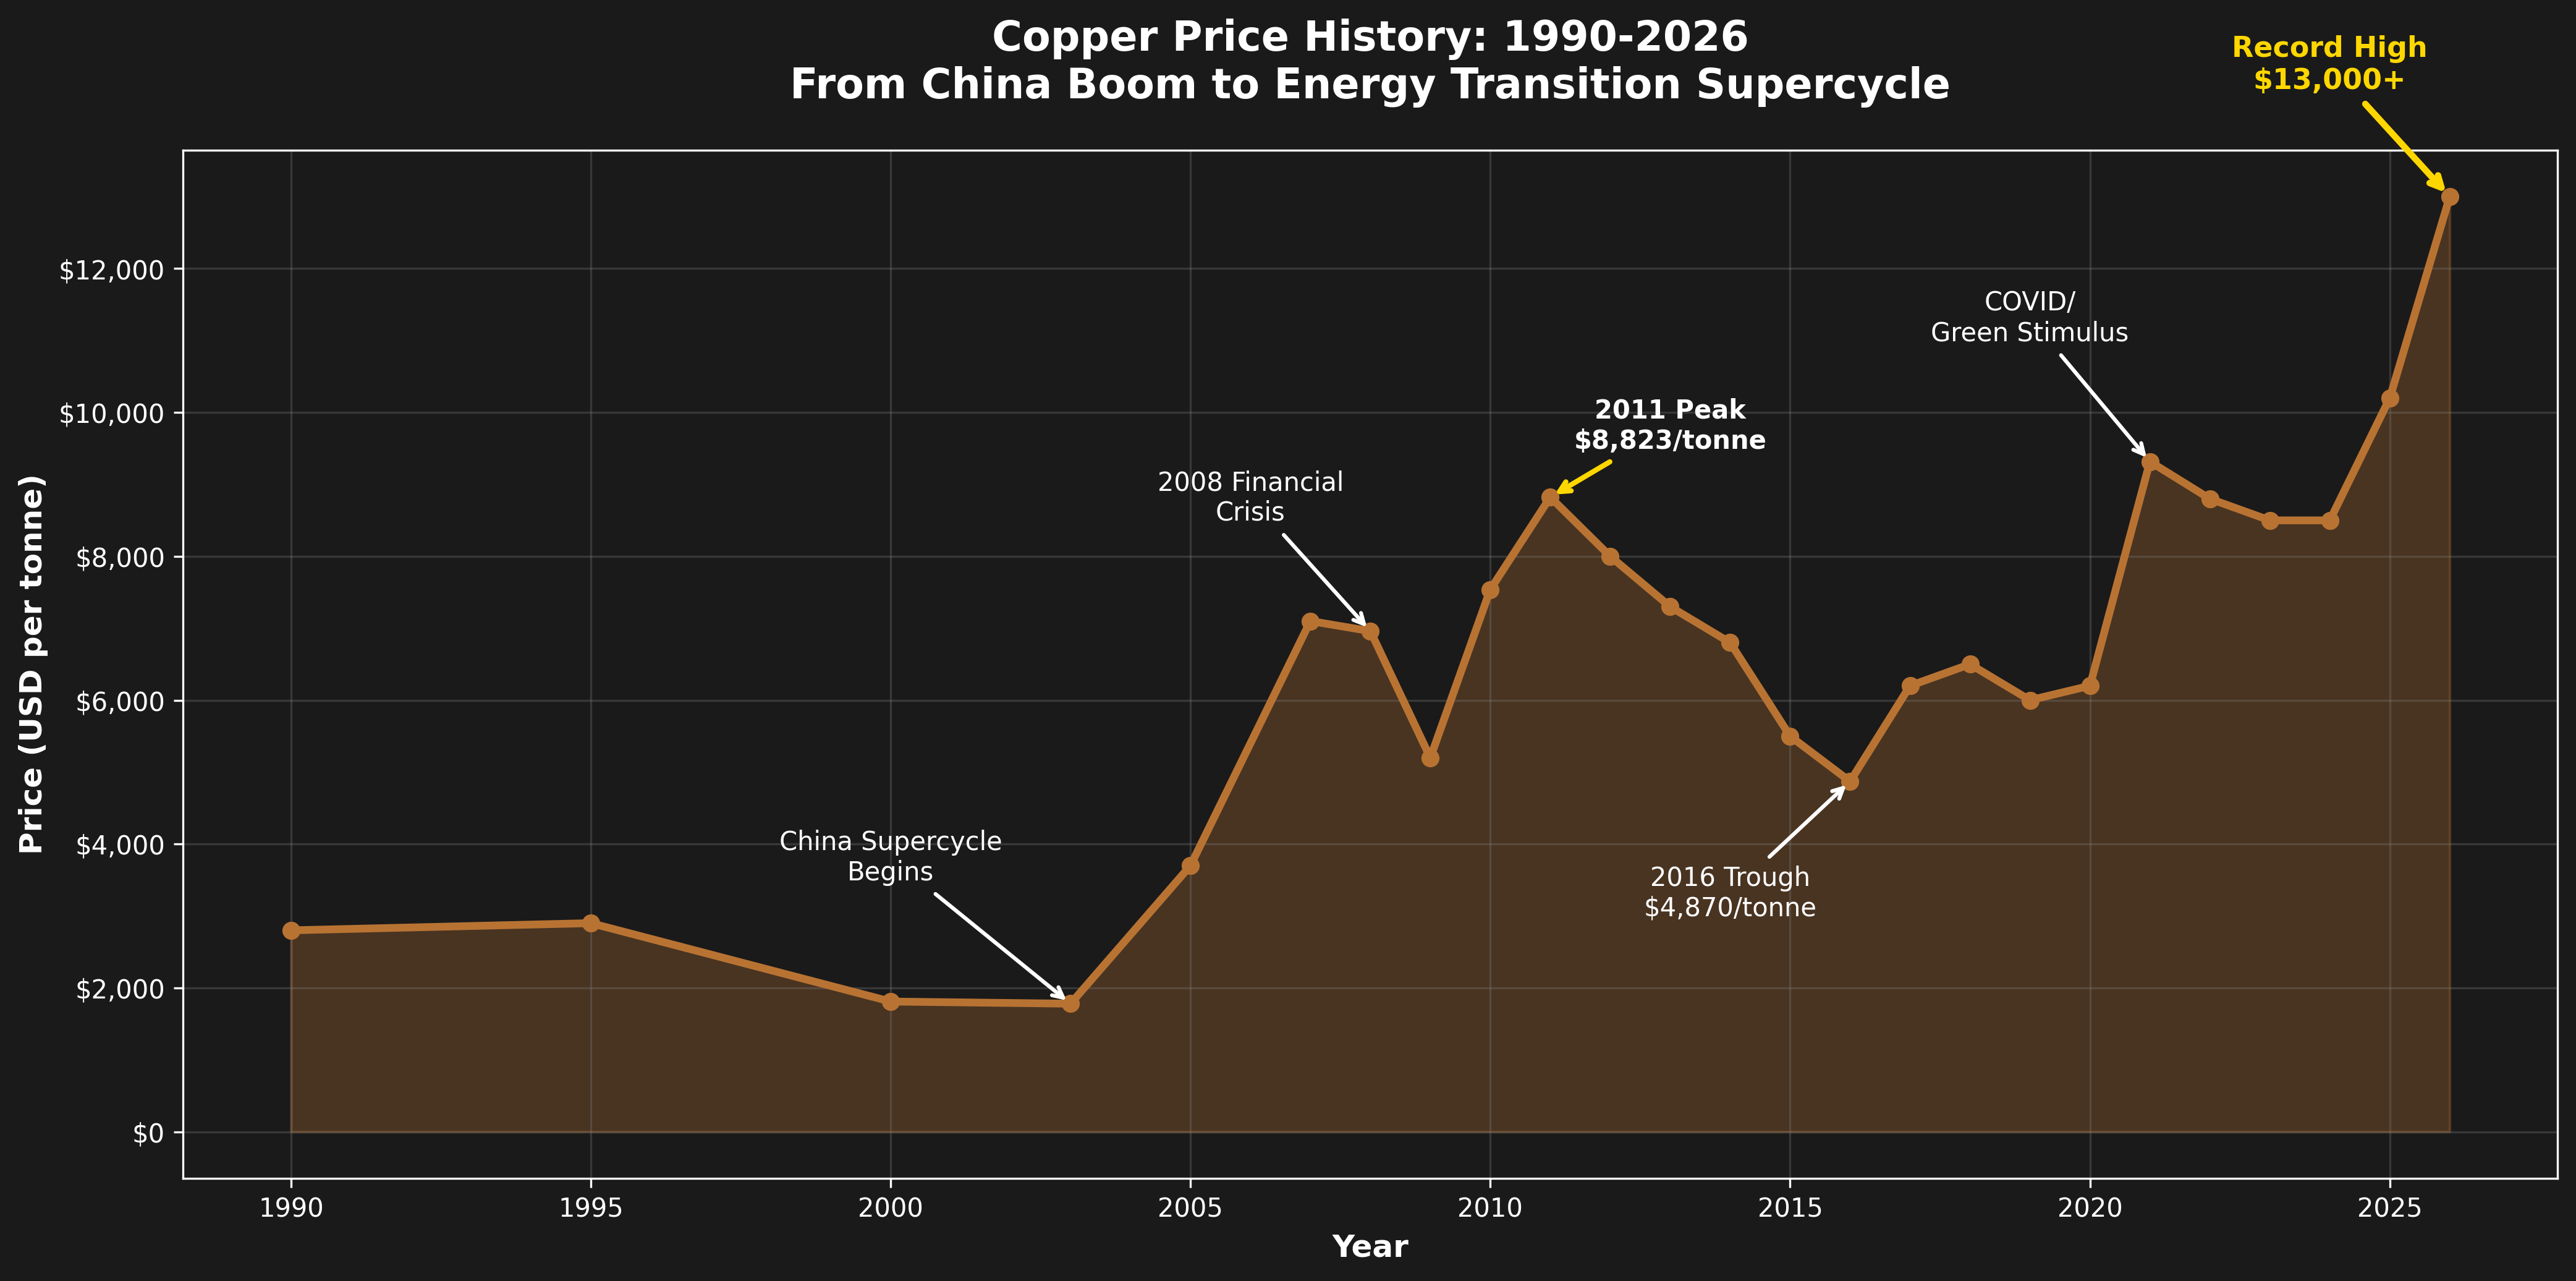 From the China supercycle ($1,500/tonne in 2003) to the energy transition supercycle ($13,000+/tonne in 2026). Note the 2008 crash, 2011 peak, and current breakout.
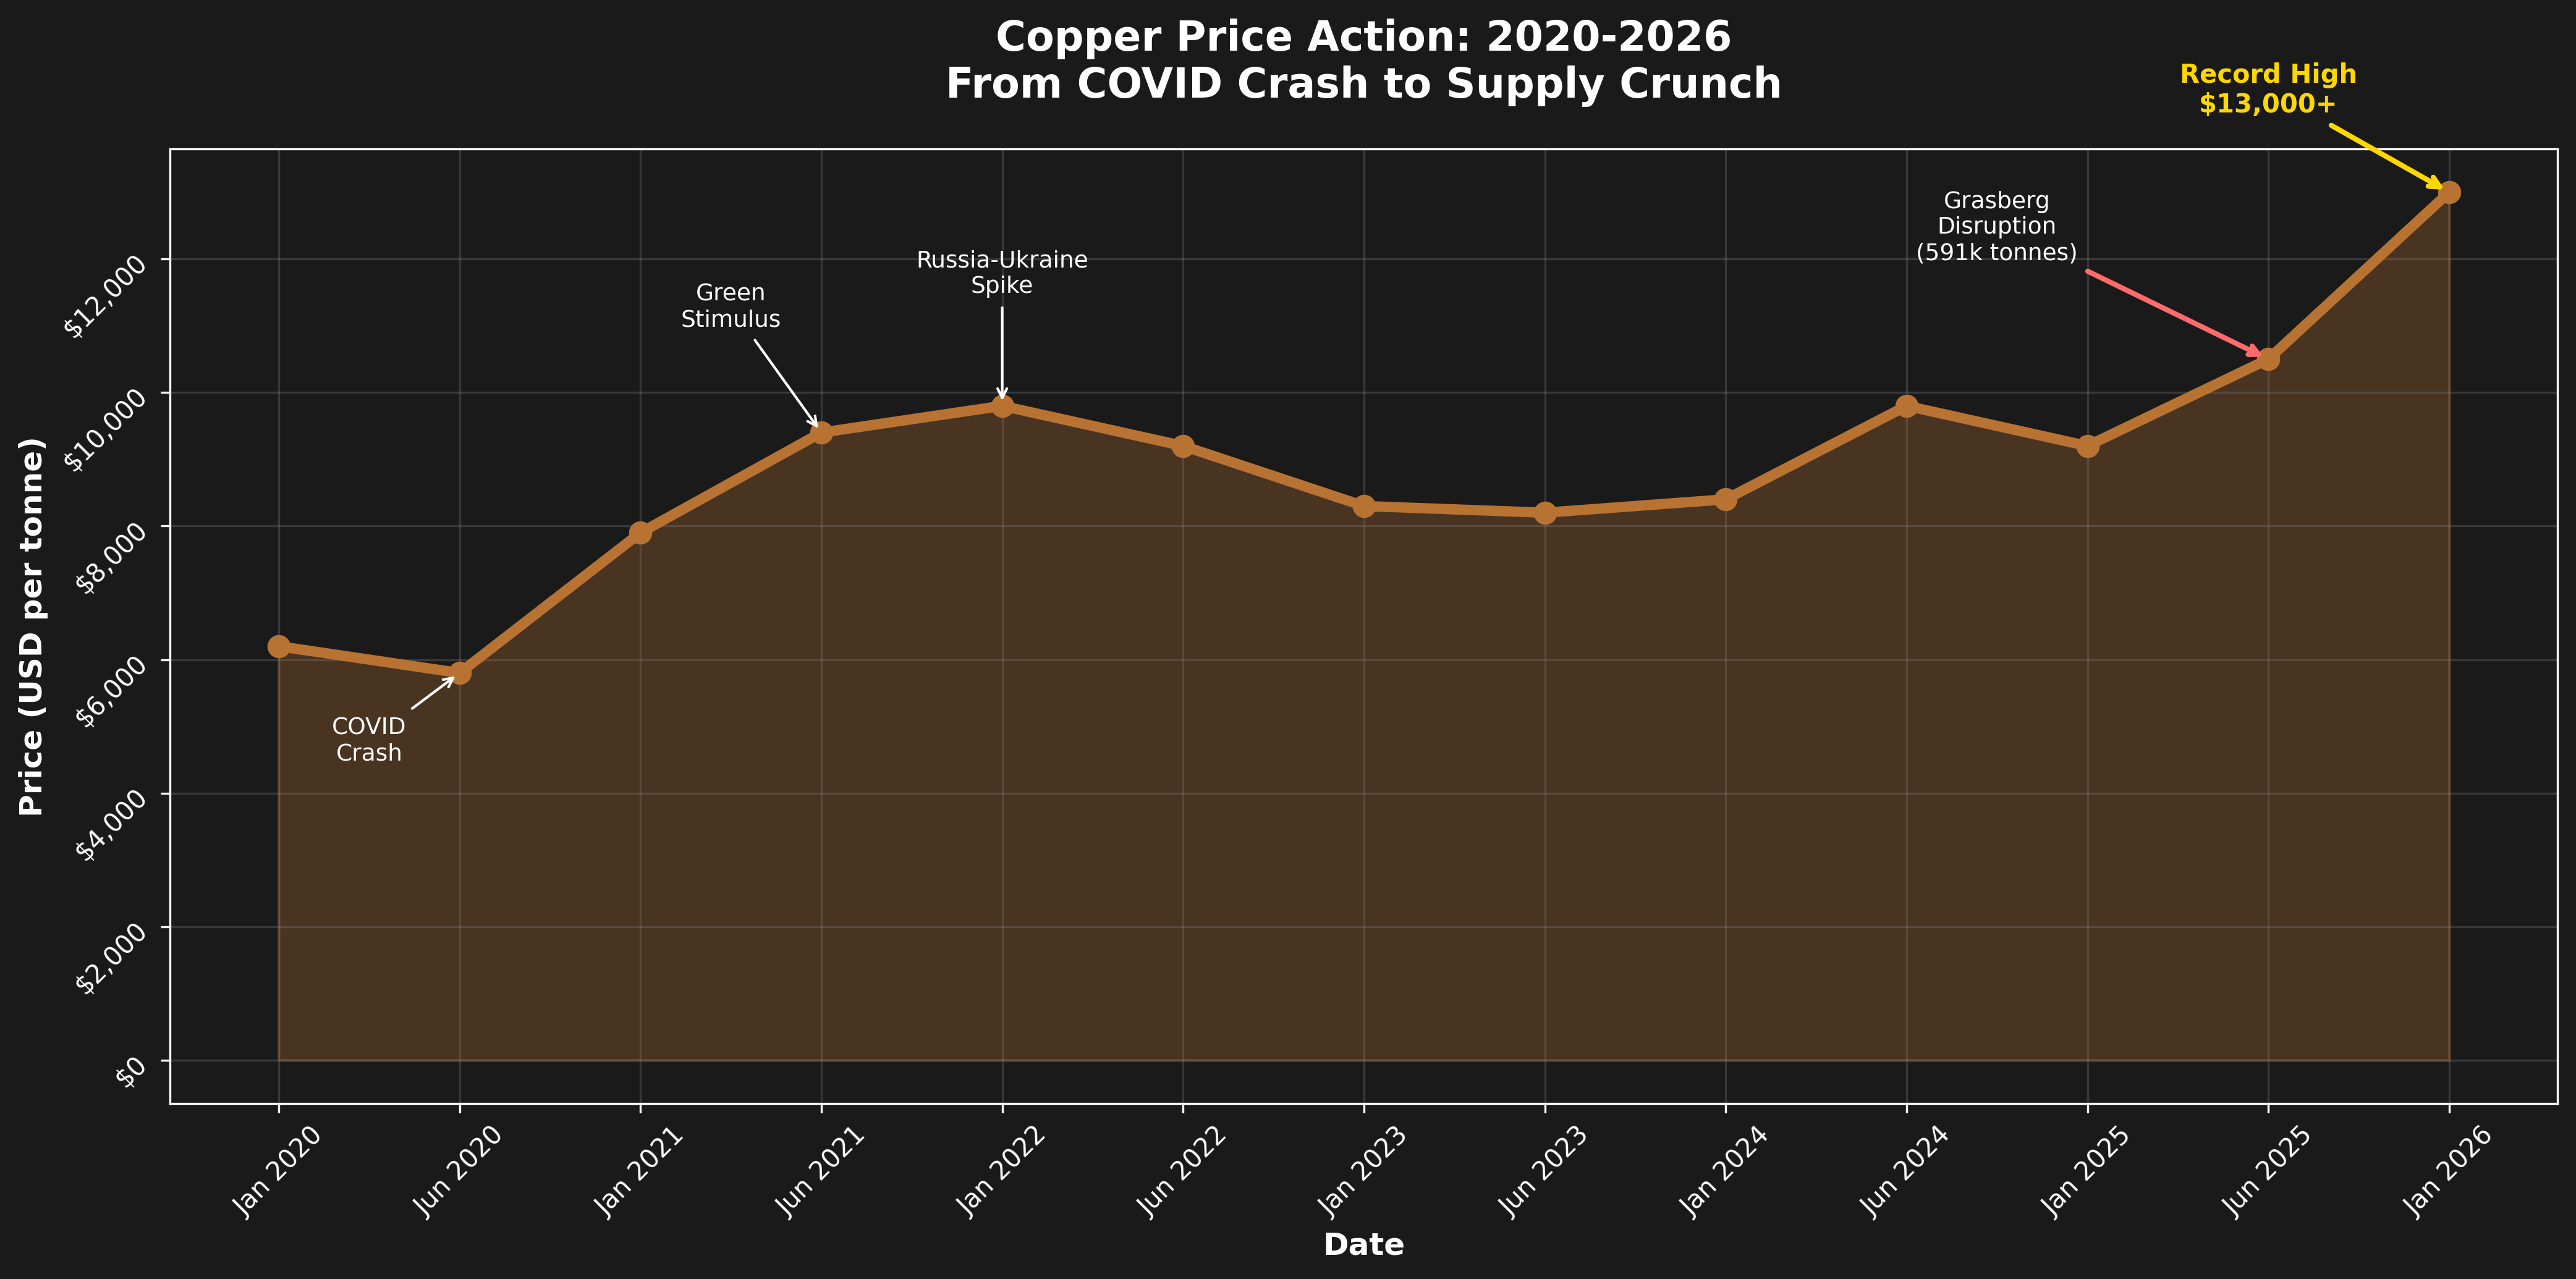 Recent price action showing the COVID crash, green stimulus recovery, and 2025-2026 supply crunch driven by Grasberg disruption and tight inventories.
How to Think About Copper as an Investment
Now we get to the practical question: If you buy Druckenmiller’s thesis—or at least find it plausible—how do you actually invest in copper?
This is where copper diverges sharply from gold and silver. The investment vehicles are limited, and each has significant drawbacks.
The Sprott Physical Copper Trust (COP)
In June 2024, Sprott launched the world’s first (and still only) physical copper ETF. It trades on the Toronto Stock Exchange under the ticker COP (or COP.UN for the USD-denominated version).
How it works: COP holds actual copper cathode in LME and CME-approved warehouses. As of early 2026, it held approximately 9,945 tonnes of copper with a net asset value around $131 million.
The good: You get direct exposure to physical copper without dealing with futures contracts or mining company operational risk. It’s the closest thing to a “GLD for copper.”
The bad:
- High fees: Management fee plus total expense ratio significantly higher than gold ETFs (approximately 1.61%). Compare that to GLD’s 0.40% or SLV’s 0.50%.
- Low liquidity: It’s a new, relatively small fund with limited trading volume.
- Redemption limitations: You can only redeem semi-annually, and physical redemption is cumbersome (you need to arrange transport from warehouses).
Why the high fees? Copper isn’t gold. A million dollars worth of gold fits in a shoebox and costs almost nothing to store securely. A million dollars worth of copper is 150 metric tonnes of metal—five truckloads. Warehousing, insurance, and logistics are expensive. Copper is about 8,000 times less value-dense than gold.
Futures-Based ETFs
There are ETFs that hold copper futures contracts rather than physical metal. These avoid the storage problem but introduce a different one: contango bleed.
When the copper curve is in contango (futures price > spot price), these funds must “roll” their positions—sell expiring contracts and buy more expensive later-dated contracts. This erodes returns over time. In a steep contango, you might lose 5-10% annually just from roll costs, even if spot copper prices stay flat.
When the curve is in backwardation (as it is now), roll yield works in your favor. But you can’t count on that persisting.
Copper Miners
You asked me not to focus on miners, and I won’t, except to say this: Mining companies provide leveraged exposure to copper prices, but they add operational complexity, political risk, and management quality as variables. A copper miner might outperform copper in a bull market (operational leverage cuts both ways), or it might underperform due to cost overruns, labor strikes, or exploration failures.
If you want pure copper price exposure, miners are an imperfect tool. If you want leveraged copper exposure and are willing to do the work analyzing specific companies, they can work. But that’s a different investment thesis.
Direct Physical Ownership
Can you just buy copper cathode and store it? Technically yes, practically no. Retail investors can’t easily access warehouse warrants or arrange delivery. Even if you could, the storage costs would eat you alive. And unlike gold or silver, there’s no retail market for copper bars or coins (at least not at anything close to reasonable premiums).
Copper is an industrial metal meant to be used, not hoarded. The lack of investment-grade physical products tells you something important about how the market views copper versus precious metals.
Gold/Silver Parallels and Divergences
Since your blog focuses heavily on gold and silver, let’s draw some explicit comparisons.
Similarities
Supply inelasticity: Like gold, primary copper supply can’t ramp up quickly. But copper’s lag is worse—12-17 years for new mines versus 5-10 years for new gold projects. And gold has the advantage of massive above-ground stocks that can be recycled into the market. Copper gets consumed; gold mostly just changes hands.
Political risk in supply: Both copper and gold production face political risk, but copper deposits are concentrated in fewer, less stable jurisdictions. Roughly 40% of copper comes from Chile, Peru, and the DRC. Gold is mined everywhere from Nevada to Western Australia to Russia.
Central bank behavior: Here’s a key difference. Central banks don’t stockpile copper. They stockpile gold. This means copper lacks the “monetary bid” that supports gold during currency crises. Copper is purely an industrial play.
Differences
Demand drivers: Gold demand is driven by investment sentiment, jewelry, central bank buying, and safe-haven flows. Copper demand is driven by construction, manufacturing, electrification, and economic growth. Gold is counter-cyclical (does well when economies struggle); copper is pro-cyclical (does well when economies boom).
Above-ground stocks: All the gold ever mined still exists—roughly 212,000 tonnes worth over $16 trillion at current prices. Annual gold production (~3,600 tonnes) adds less than 2% to this stockpile. Copper, by contrast, is consumed. Annual copper production (~23 million tonnes) goes into buildings, vehicles, and infrastructure. Only about 17% comes from recycling. There’s no giant above-ground stock to buffer supply shocks.
Inventory transparency: Gold ETF holdings (GLD, IAU, etc.) provide clear visibility into investment demand. Copper inventories are fragmented across exchanges, bonded warehouses, producer stocks, and consumer inventories. This opacity makes the copper market harder to read.
Futures curves: Gold curves are usually gently contangoed, reflecting storage costs. Copper curves can swing wildly between steep contango and steep backwardation based on physical market conditions. Reading copper curves requires understanding industrial demand patterns, not just monetary policy.
The Bottom Line: Where Does Copper Go From Here?
After all this research, here’s my honest assessment:
The bullish case is structurally sound. Supply constraints are real and persistent. Ore grades are declining. Mine development takes forever. Political risk is rising. And demand from electrification isn’t a fad—it’s government policy backed by trillions in spending.
But the path won’t be straight up. Copper is cyclical. If we get a hard landing in the global economy, copper will get hit harder than gold. China’s property sector remains a wildcard. And high prices will eventually stimulate substitution (aluminum in some applications) and scrap supply.
The inventory situation is genuinely extreme. Exchange stocks covering 2-4 days of consumption is not sustainable. Either prices rise to ration demand, or we see forced destocking that crashes end-user availability. Given the political importance of copper for energy transition goals, governments may become buyers of last resort if prices spike.
For the Sprott ETF specifically: The 1.61% expense ratio is painful, but if you believe copper goes to $15,000 or $20,000/tonne over the next 5-7 years, the fee is manageable. It’s the only practical way for retail investors to get direct copper exposure. Just understand what you’re buying: an industrial metal subject to recession risk, not a crisis hedge like gold.
Druckenmiller’s “tightest I’ve ever seen” comment isn’t hyperbole. The supply-demand math is genuinely challenging. But copper isn’t gold—it’s a bet on economic growth, electrification, and industrialization continuing apace. If you believe in the energy transition, copper is the purest way to play it. Just buckle up for volatility.
Charts That Would Strengthen This Analysis
Visualizing the copper market dynamics would make several of these concepts clearer. Here are the key charts worth creating or sourcing:
1. Global Copper Supply vs. Demand (2010-2035)
A dual-axis line chart showing:
- Historical production (actual) vs. demand (actual) from 2010-2024
- Projected supply gap growing from 2025-2035
- Highlight the crossover point where structural deficit emerges
- Source data: ICSG, S&P Global, Wood Mackenzie
2. Ore Grade Decline by Major Producing Country
A line chart tracking average copper ore grades over time (1999-2024) for:
- Chile
- Peru
- Global average
- Shows the inexorable decline from ~1.5% to ~0.6%
- Source data: Cochilco, USGS, company reports
3. Copper Inventory Levels: Days of Consumption Coverage
A historical chart (2000-2026) showing:
- LME + COMEX + SHFE exchange stocks
- Divided by annual consumption = days covered
- Highlight the current extreme low vs. historical 10-14 day average
- Source data: LME, COMEX, SHFE, ICSG
4. Copper Demand by End Use (Pie Chart)
Visual breakdown of 2024 demand:
- Construction (26%)
- Electrical/Electronics (23%)
- Power Infrastructure (17%)
- Transportation (13%)
- Industrial Equipment (12%)
- Other (9%)
- Source: ICSG World Copper Factbook 2024
5. The Energy Transition Multiplier
A comparative bar chart showing copper intensity:
- ICE vehicle: 23 kg
- Hybrid: 40 kg
- PHEV: 60 kg
- BEV: 83 kg
- Electric bus: 250+ kg
- Include solar (4-5 tonnes/MW) and wind (3-10 tonnes/MW) for context
- Source: International Copper Association, IEA
6. Mine Development Timeline: Discovery to Production
A horizontal bar chart showing average years for:
- Global average: 17 years
- US: 24-29 years
- Canada: ~20 years
- Australia: ~20 years
- Zambia: ~34 years
- Illustrates why supply can’t respond quickly to price signals
- Source: S&P Global, mining industry data
7. Regional Price Differentials (Shanghai Premium/Discount)
Time series chart showing:
- LME copper price (USD/tonne)
- SHFE copper price (converted to USD)
- The premium/discount spread
- Shows when China is importing (positive premium) vs. exporting (negative premium)
- Source: LME, SHFE, Bloomberg
8. Historical Copper Prices with Supercycle Overlay
Long-term price chart (1970-2026) with annotations:
- 1996-2011: China supercycle
- 2020-2026: Energy transition supercycle (current)
- Highlight the 2008 crash, 2011 peak, 2016 trough, 2021 highs
- Include inflation-adjusted prices for context
- Source: World Bank, FRED
9. Copper Stock-to-Use Ratio vs. Price
Scatter plot or dual-axis chart showing:
- Stock-to-use ratio on one axis (inverted)
- Copper price on the other
- Demonstrates the inverse relationship
- Highlight current extreme tightness
- Source: ICSG, LME price data
10. Investment Options Comparison Table
A matrix comparing:
- Physical ETF (COP): Fees, liquidity, roll yield, accessibility
- Futures-based ETFs: Contango risk, fees, tracking error
- Miners: Operational leverage, company-specific risk, dividends
- Direct physical: Practical barriers, storage costs
Data sources: USGS Mineral Commodity Summaries, International Copper Study Group (ICSG), S&P Global, Wood Mackenzie, LME, COMEX, company annual reports, and various financial news outlets. Price data current as of early 2026.
Disclaimer: This is research, not investment advice. Copper is volatile, and you can lose money. Do your own due diligence.