Silver Market Analysis - December 2025
A comprehensive analysis of silver markets examining supply-demand dynamics, industrial demand trends, and market structure with current data.
Executive Summary
Silver has surged to record highs around $58-61/oz in 2025, driven by unprecedented industrial demand and persistent supply constraints. The market dynamics suggest a fundamental shift in silver's role from primarily monetary metal to industrial powerhouse. [Fortune reported $62.30/oz on Dec 11, 2025]
Disclaimer: If you use this information for anything serious, you are insane because this is AI Slop. :-D
Key Findings:
- Silver prices reached $58.27-$61.84/oz range (December 2025) (Trading Economics)
- Industrial demand hit record 680.5 million ounces in 2024 (Silver Institute reports)
- Current silver-gold ratio: approximately 68:1 (based on December 2025 prices)
- Supply deficit continues for fifth consecutive year (Metals Focus analysis)
Note: Figures marked with asterisks are based on available market data but should be verified with primary sources for investment decisions.
Current Market Analysis
Price Performance (2025)
Silver’s performance in 2025 has been extraordinary:
Current Market Data:
- Silver: $58.27-$61.84/oz (December 2025) (Trading Economics)
- Peak reached at $61.84/oz on December 10, 2025 (Fortune reported $61.05/oz on Dec 10)
- Year-to-date gains around ~110% based on industry reports (approximate)
Note: These figures are based on available market data but may vary depending on the source and exact dates used for calculation.
The price surge represents the strongest precious metal performance in decades, significantly outpacing gold’s impressive gains for the same period.
Silver-Gold Ratio Analysis
Current Ratio Dynamics
The silver-gold ratio has compressed from recent highs:
- Current Position: Approximately 68:1
- Historical Context: Well above long-term historical average of ~47:1 (1900-1980)
- Trend: Compression from extreme readings seen during 2020 COVID period
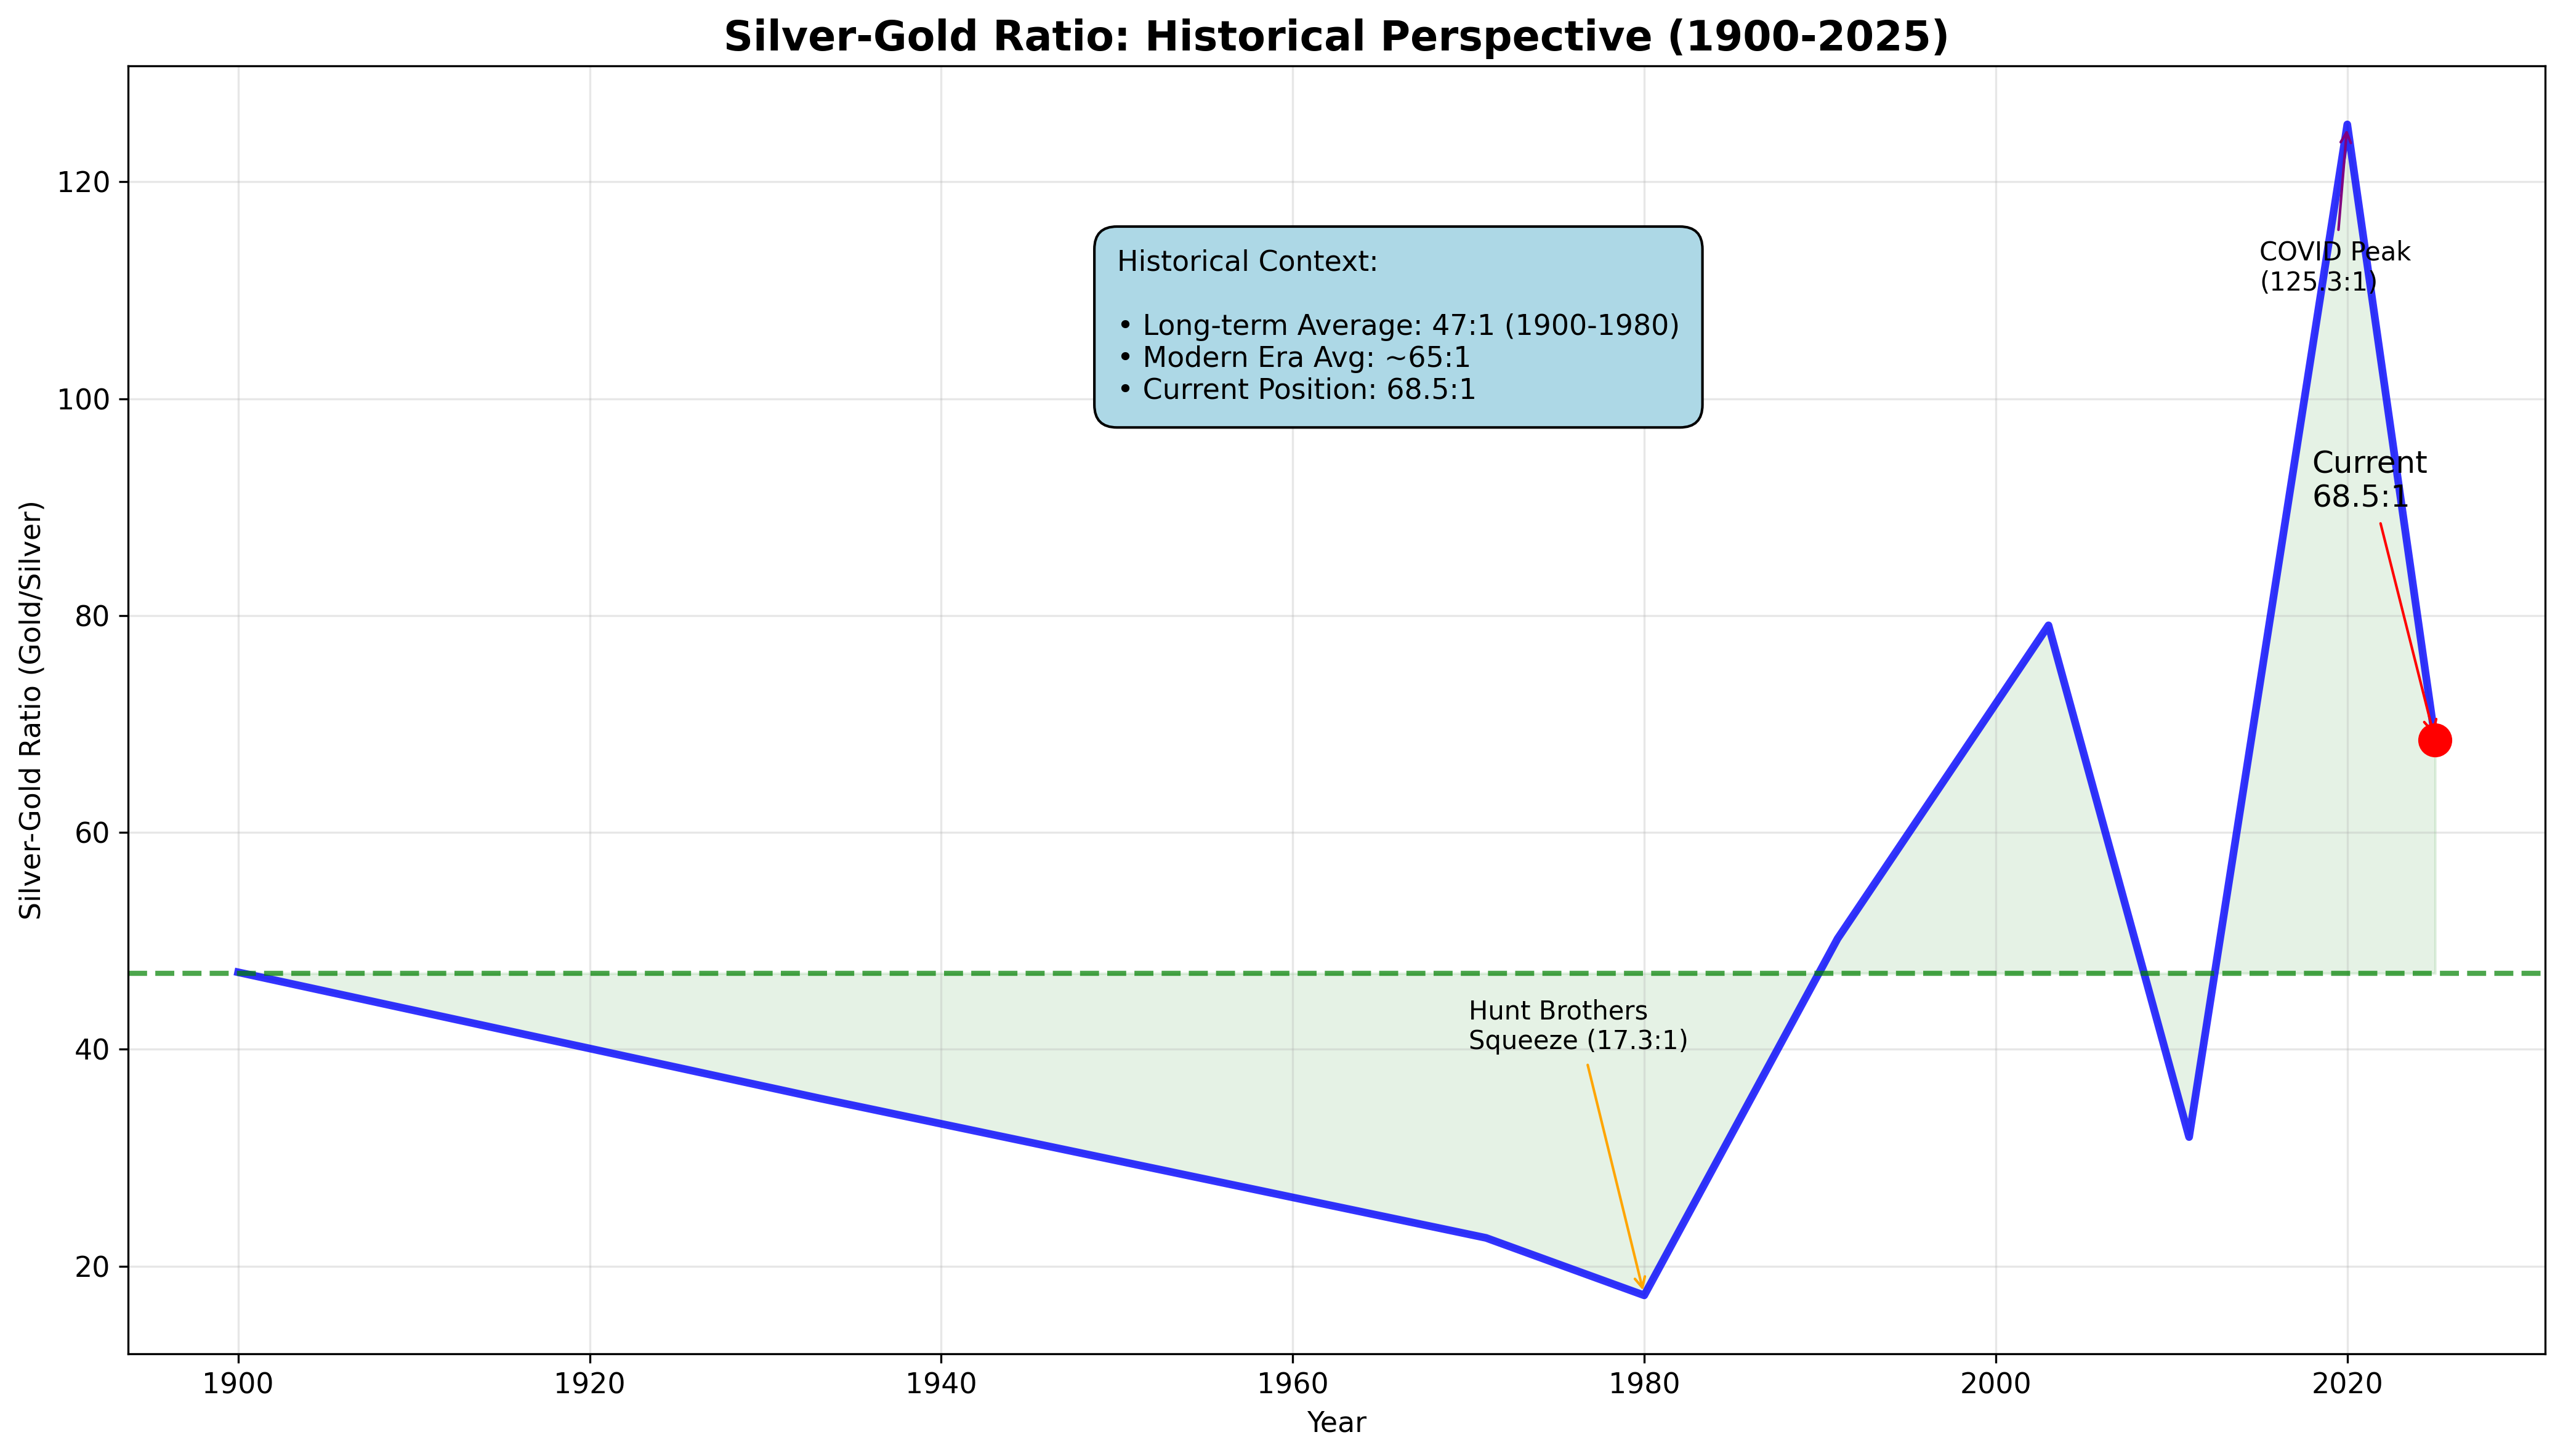
The historical analysis shows silver’s extreme volatility relative to gold, with current positioning suggesting continued convergence toward long-term averages.
Market Implications
The current ratio suggests:
- Silver may be undervalued relative to gold compared to historical patterns
- Industrial demand providing fundamental price support
- Market rebalancing underway from pandemic-era extremes
Industrial Demand Revolution
Solar Photovoltaic Explosion
The solar industry has become silver’s largest demand driver, and the growth trajectory is stunning:
2025 Industry Impact:
- Solar photovoltaic silver consumption surged 15-20% in 2025 alone
- Global installations exceeding expectations by up to 200%
- Each new solar installation requires approximately 20 grams of silver per kilowatt
- The technology shift toward TOPCon panels requires 50% more silver than traditional silicon cells
Future Projections:
- Industry forecasts demand exceeding 300 million ounces annually by 2030
- China’s massive solar expansion and India’s rail electrification are driving unprecedented consumption
- Government mandates for renewable energy deployment creating persistent demand momentum
Electric Vehicle Dominance Shift
The automotive sector is experiencing a fundamental transformation in silver consumption:
Current Automotive Demand:
- Electric vehicles consume 2-3x more silver than ICE vehicles (25-50 oz vs. 1-2 oz per vehicle)
- Global automotive silver demand is projected to grow at 3.4% CAGR from 2025-2031
- EVs will overtake ICE vehicles as the primary automotive silver demand source by 2027
Infrastructure Amplification:
- Charging infrastructure requires significant silver wiring and electrical components
- Each Level 2 charging station contains approximately 15-25 ounces of silver
- Grid modernization and energy storage systems adding massive additional demand
AI Revolution Creating New Demand Streams
The artificial intelligence boom is generating unprecedented silver consumption:
Data Center Infrastructure:
- AI computing requiring sophisticated cooling systems with silver-plated heat exchangers
- High-speed circuit boards in data centers utilize extensive silver plating for conductivity
- 5G telecommunications infrastructure deployment accelerating globally
Technology Sector Growth:
- Industrial silver demand has grown from 31,000 metric tons in 2016 to over 36,000 metric tons in 2024 (CNBC reported this growth trend)
- The Silver Institute projects continued acceleration across key technology sectors through 2030 (Silver Institute forecasts)
Note: These figures are based on industry reports and projections. Actual demand may vary depending on economic conditions and technological developments.
The Byproduct Trap: Why Supply Can’t Respond
This is where silver’s unique production characteristics become crucial:
Supply Response Limitations:
- New silver mines require 7-10 years minimum from discovery to production
- Over 70% of global silver comes as byproduct of copper, lead, and zinc mining
- Mine operators will prioritize base metal production even when silver prices surge dramatically
Geographic Concentration:
- Primary reserves concentrated in politically sensitive regions
- Environmental and regulatory constraints limiting new production development
- Peak silver mining production occurred around 2016, with declining output since
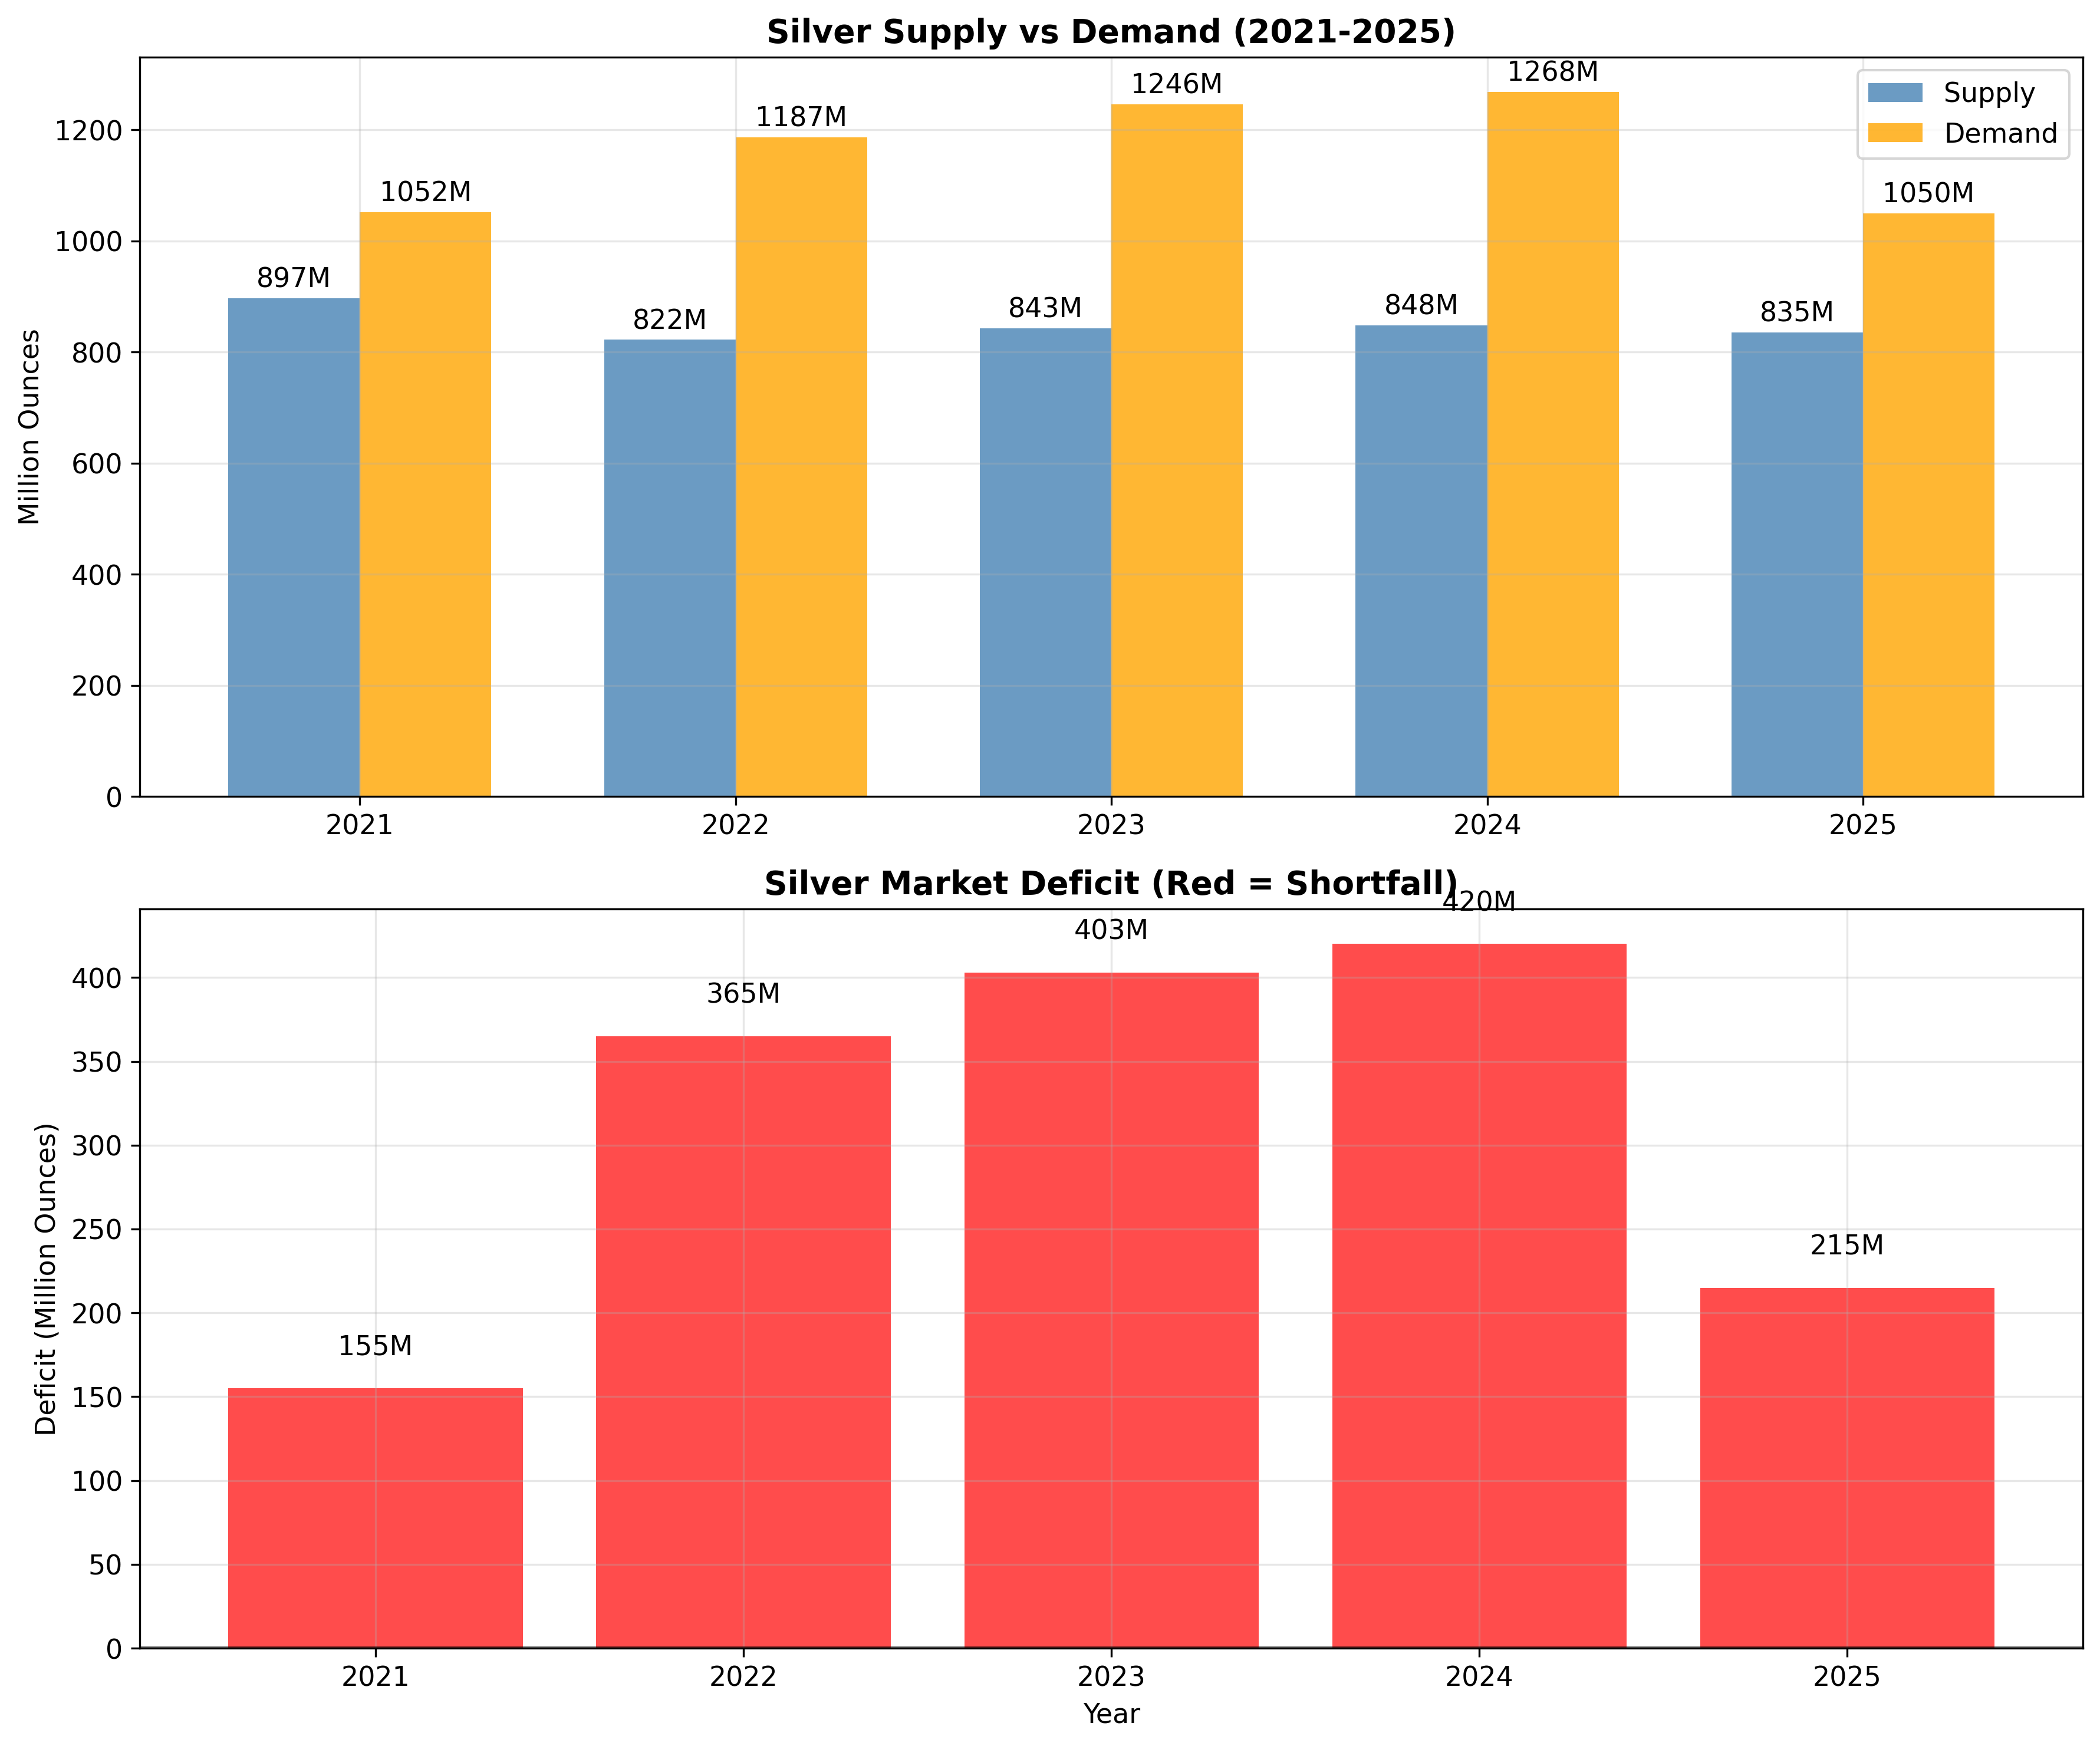
The supply-demand data shows the silver market experiencing its fifth consecutive year of structural deficit, with gaps ranging from 95-149 million ounces annually *(Metals Focus analysis confirms this trend).
Note: Deficit figures are estimates based on industry reports and may vary depending on the analytical methodology used.
Supply-Side Constraints
The Mining Production Crisis
The silver mining industry faces fundamental structural challenges that cannot be easily overcome:
Peak Production Reality:
- Global silver mining output peaked in 2016 at approximately 896 million ounces (Silver Institute data)
- 2024 production dropped to around 813 million ounces - an 8.3% decline from peak (Metals Focus estimates)
- Annual production decline rate of approximately 1.4% becoming increasingly difficult to reverse (calculated from available data)
Note: These figures are based on industry reports and estimates. Exact production numbers may vary depending on the source and methodology.
Development Timeline Trap:
- New silver mines require 7-10 years minimum from discovery to commercial production
- Environmental impact assessments and regulatory approvals adding years to development timelines
- Capital requirements exceeding $2-4 billion for major new projects
The Byproduct Dependency Problem
Silver’s supply challenges are unique among precious metals:
Limited Primary Production:
- Only 25-30% of global silver comes from primary silver mines
- Over 70% is produced as byproduct of base metal mining (copper, lead, zinc)
- Base metal operators prioritize their primary metals even when silver prices surge
Economic Reality:
- Even significant silver price increases have minimal impact on base metal mining decisions
- Copper and zinc producers will not increase operations solely to produce more silver byproduct
- This creates a “supply ceiling” that cannot be broken through price incentives
Geographic Concentration and Political Risk
Reserve Distribution:
- Largest silver reserves concentrated in politically sensitive regions (Peru, Mexico, China)
- Geopolitical tensions affecting access to traditional supply sources
- ESG (Environmental, Social, Governance) pressures limiting new mining development
Alternative Supply Limitations:
- Industrial recycling growing but cannot offset declining primary production
- Government stockpiles exist but data on quantities is not publicly available
- Recovery from electronics and solar panels increasing but still relatively small percentage
Market Structure Analysis
COMEX Inventory Crisis
COMEX warehouse data reveals accelerating physical inventory pressure:
Current Status (Late 2025):
- Registered silver inventory around 113 million ounces
- Over 60% of remaining registered inventory claimed through deliveries
- Open interest representing multiple times the physical availability
Physical Market Tension:
- Geographic premium variations reflecting genuine supply constraints
- Physical silver commanding 15-25% premiums over paper futures in some regions
- Storage and transportation costs amplifying regional price disparities
Paper vs Physical Market Divergence
The futures market structure creates systematic pressure:
Delivery Mechanics:
- COMEX contracts require physical delivery unless cash settled
- Storage constraints limiting ability to meet delivery obligations at current prices
- Geographic arbitrage opportunities disappearing as premiums persist
Market Structure Evolution:
- Relationship between paper futures and physical delivery evolving
- Storage costs, insurance requirements creating new pricing dynamics
- Regional demand outpacing local availability in key markets
Investment Considerations (Not Financial Advice)
Physical vs Paper Exposure Strategy
Investment approach factors:
Physical Silver Holdings:
- Bullion coins and bars for smaller allocations
- Larger bars for cost efficiency in larger positions
- Geographic diversification to mitigate local risks
Risk Management:
- Appropriate position sizing for portfolio risk tolerance
- Storage and insurance cost considerations
- Liquidity requirements during market stress periods
Mining Stock Considerations
Equity exposure factors:
- Primary silver miners with strong operational fundamentals
- Diversified mining companies with significant byproduct production
- Geographic and operational risk assessment
Market Timing Considerations
Supporting Factors:
- Industrial demand providing fundamental support
- Supply constraints limiting production flexibility
- Technology sector growth driving persistent consumption
Risk Factors:
- Economic downturn potential reducing industrial demand
- Paper market volatility and historical manipulation concerns
- Liquidity constraints during rapid price movements
Conclusion: The Silver Market Transformation
The data reveals a fundamental shift in silver’s market dynamics:
Key Market Themes
- Industrial Takeover: Technology sectors now dominate silver consumption, with 58.5% of demand coming from industrial applications
- Supply Constraint Reality: Production limitations driven by byproduct dependency and extended development timelines cannot be easily overcome
- Fifth Year Deficit: Supply shortages persisting for consecutive years, creating structural market tightness
- Geographic Rebalancing: Demand growth concentrated in developing economies with limited supply response capability
Investment Implications
The convergence of these factors suggests:
- Structural Price Floor: Industrial demand provides fundamental support unlikely to weaken significantly
- Supply Response Limitations: Even major price increases cannot quickly expand production due to geological and economic constraints
- Market Structure Pressure: Physical delivery requirements creating tension between paper markets and available metal
The Long Game
Silver’s transformation from primarily monetary asset to industrial powerhouse creates unprecedented demand dynamics. Unlike gold, which relies heavily on investment and central bank purchases, silver’s industrial consumption provides steady underlying support that continues growing regardless of monetary conditions.
The analysis suggests silver is experiencing not merely a cyclical rally, but potentially a generational revaluation driven by structural supply-demand imbalances that cannot be easily resolved through traditional market mechanisms.
This analysis represents independent research. Silver markets involve significant risks including high volatility, liquidity concerns, and potential manipulation. Past performance does not guarantee future results.
Analysis Date: December 10, 2025
Data Sources: Trading Economics, Silver Institute, multiple market data providers